Point Valuation Framework — Gomble Airdrop Case Study
Setting up a Point Value Evaluation Framework through the Gomble Case

*Please note that this article was made under many assumptions and it can’t be used as evidence for financial activities.
1. Introduction
The point system is becoming a standard way to airdrop tokens nowadays. However, as points are handled off-chain and allocation is often undisclosed, it's unclear for users to estimate how many tokens they will receive and their worth.
The point market of Whales market is a good solution for pre-market price discovery, but it doesn't help us determine whether it's worth participating before the market opens.
If a project distributes points through various methods (e.g., staking, social missions, etc.), it becomes even more unclear to estimate the value of a point. Social missions are a main factor of ambiguity as they cause inflation. However, there's always a clue if money is involved (e.g., staking). For instance, point farming using ETH staking where there's a clear benchmark indicator (APY) is available to understand the distribution logic and predict the value of a point.
Through the point valuation framework, you'll be able to obtain the following information to decide whether it's worth participating in an airdrop campaign or not.
- Calculate the conversion ratio between point and token
- Understand the cost of capital (expected return) to simulate point, token mining cost, and FDV
- Create a scenario of expected return based on the FDV of benchmark projects
Today, I brought the Gomble airdrop campaign as a case study to show how the point valuation framework works.
2. Prerequisites
Following factors should be identified or assumed to calculate cost and evaluate point and token price.
- Total supply of token
- Total airdrop allocation
- Total supply of point
- Total points distributed to staking (Or points per Staking assets)
- Staking duration
- Expected return
- TVL
- Benchmark projects
3. Basic informations about the Gomble Airdrop
- According to Gomble vision paper, 10%(100M) is allocated for airdrop with total supply of 1B $G
- Total supply of token : 1B $G
- Total airdrop allocation : 100M $G

- Gomble recently released a staking campaign with following information of total Mystery Marble(equivalent to point) distributed to staking and staking duration.
- The total number of Mystery Marbles distributed per day is 616,320,000, 40,060,800,000 at a 3:1:1 ratio as follows.
- BNB pool: 369,792,000 MM
- USDT pool: 123,264,000 MM
- USDC pool: 123,264,000 MM
- Staking Duration : 65 days
- 2024-02-29, 05:00AM UTC
- 2024-05-05 05:00AM UTC
- The total number of Mystery Marbles distributed per day is 616,320,000, 40,060,800,000 at a 3:1:1 ratio as follows.
We need to assume following factors:
- MM(Mystery Marbles) can be earned through staking and social missions. Total supply of points cannot be estimated as social mission creates inflation of total supply. Therefore, the share of staking MM rewards needs to be simulated.
- TVL : While it’s flexible staking, I’ll assume that TVL is fixed from day 1 and locked for 65 days (It’s flexible staking).
- Expected return : Even TVL is fixed, expected return is volatile as weight of each pool is different by the time and dollar value of BNB keep changing. For the calculation, I’ll assume that;
- Price, APR of each asset is fixed
- TVL ratio of BNB, USDT, and USDC is fixed to 3:1:1
- (Additional) 100% of the tokens will be airdropped at TGE.
- (Additional) Won't count MM burn from Dare. Dare is a zero-sum PvP betting game with a 10% house edge.
4. Calculating MM(Mystery Marbles) ↔ $G conversion ratio
Currently, there are two ways to acquire MM (Mystery Marbles):
- Social missions
- Staking
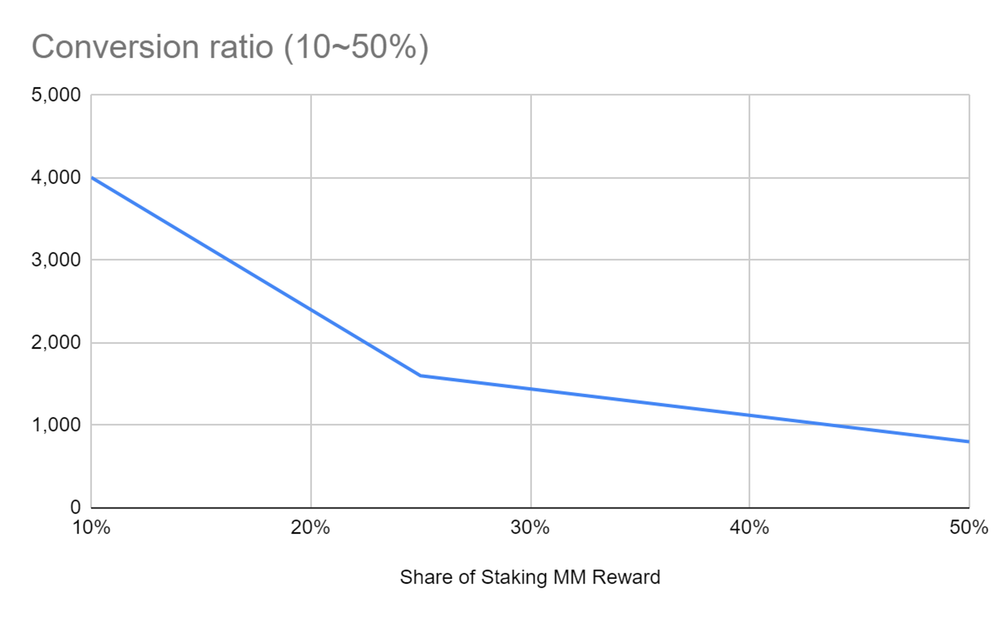
While staking has a fixed amount of MM, MM acquired through social missions is inflationary (as it's easy to launch a Sybil attack). Therefore, we need to calculate the conversion rate using the share of MM from the staking pool with the equation below.
Conversion rate = Total MM for staking / (Share of staking MM * Total $G distributed to MM)
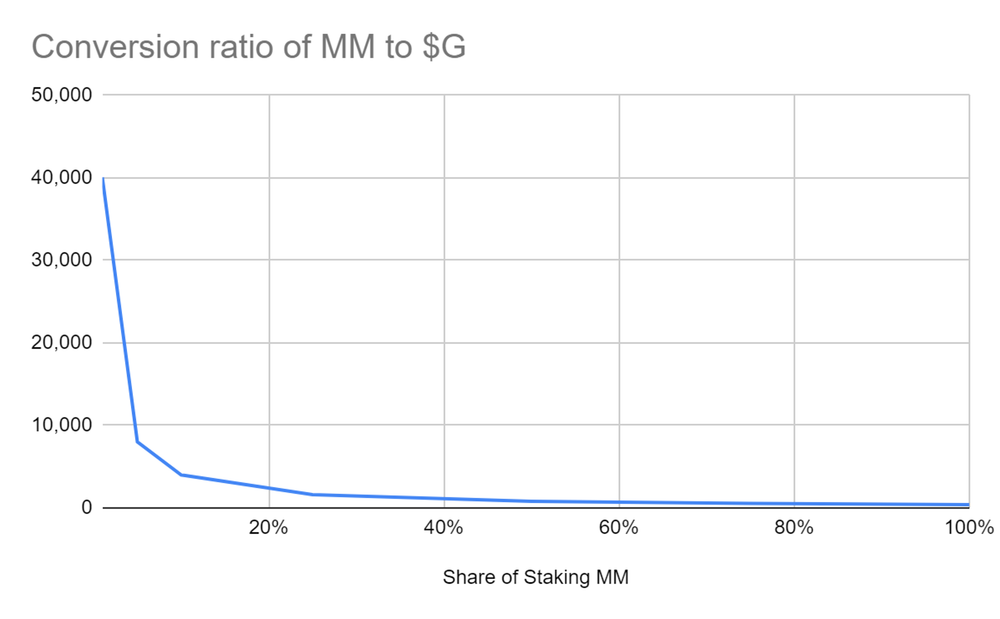
Seems like the 0~10% range is too volatile, so let’s assume the range between 10~50% and draw a graph.
| Total MM from Staking | 40,060,800,000 |
|---|---|
| Total $G distributed to MM | 100,000,000 |
| Total $G supply | 1,000,000,000 |
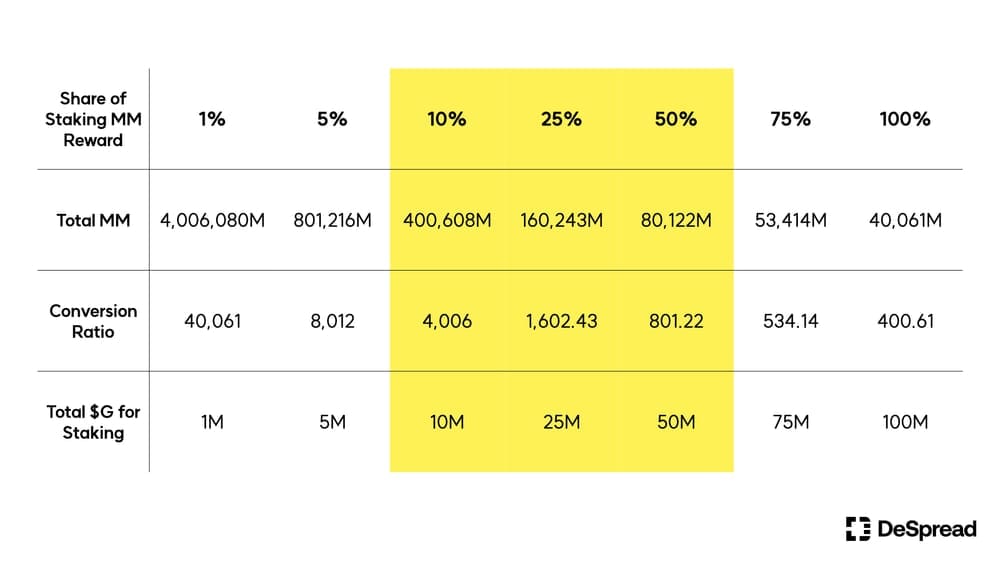
One more thing to consider is that, on February 22, Gomble announced NFT collections named SpaceKids Saga and OG Spaceship. The OG Spaceship collection will be distributed to early contributors and auctioned off between March and April.
As Spaceship NFTs will be purchased and SpaceKids free mint WL will be distributed via staking and airdrop campaigns, it's crucial to account for these allocations.
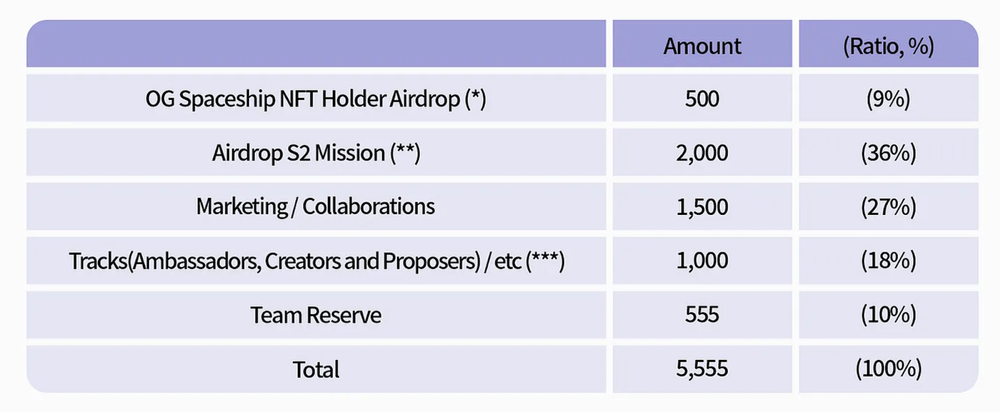
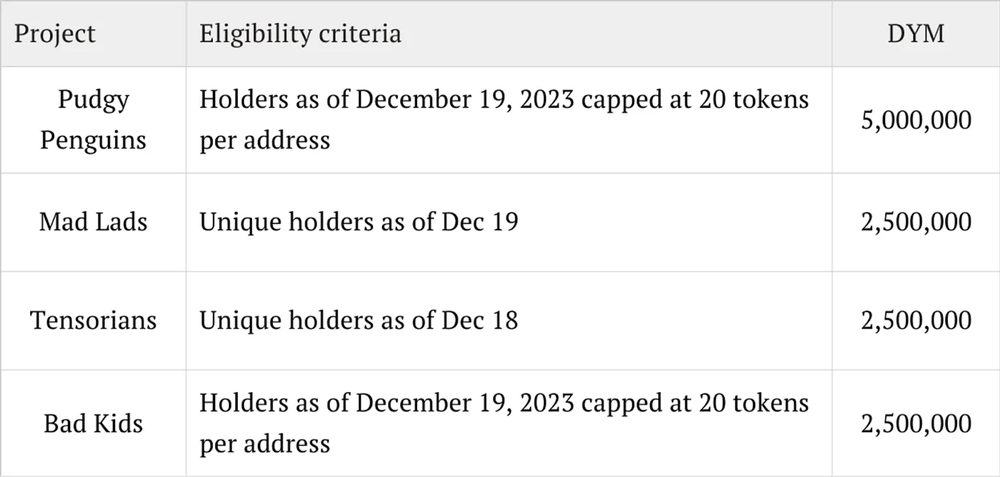
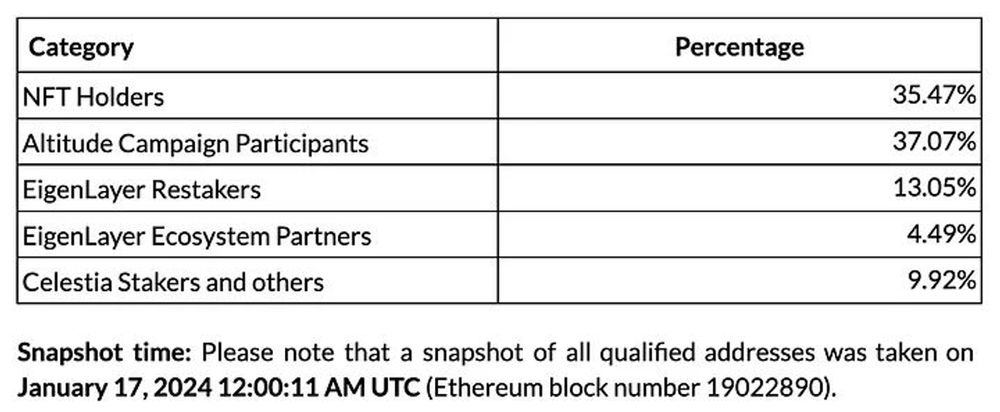
How many tokens will be airdropped? Nobody knows, but Dymension and AltLayer's airdrop allocations can be used as benchmarks.
- Dymension airdropped 1.25% of the total supply to various collections
- AltLayer allocated 1.06% of the total supply to NFT holders
Considering NFTs that Gomble launch will have an important role in the ecosystem(e.g DAO), let’s assume that 2% of total supply will be allocated to Spaceship and SpaceKids.
| Total MM from Staking | 40,060,800,000 |
|---|---|
| Total $G distributed to MM | 80,000,000 |
| Total $G for NFT | 20,000,000 |
| Total $G supply | 1,000,000,000 |
And here’s the adjusted conversion ratio changed to 5,008:1 ~ 1,002:1.
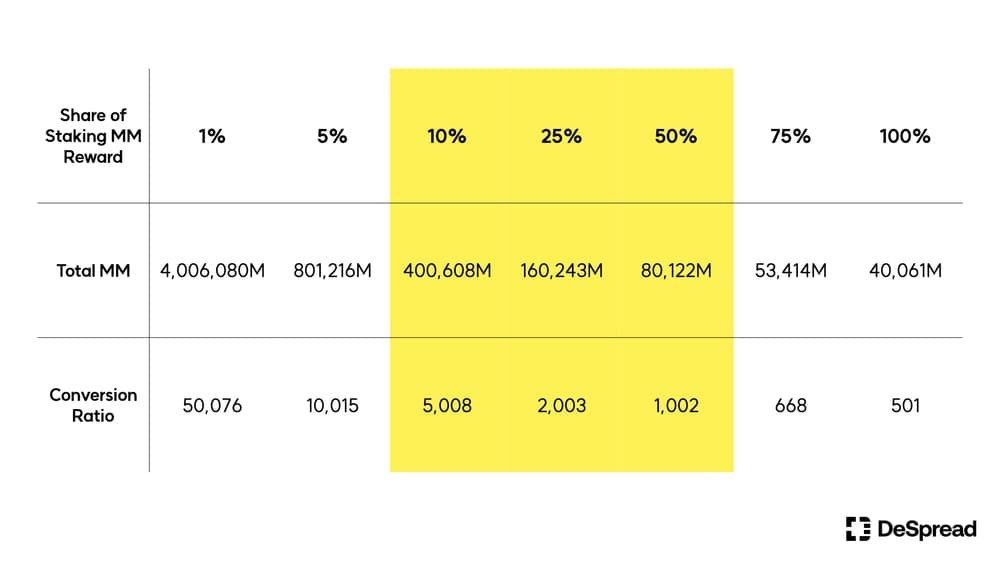
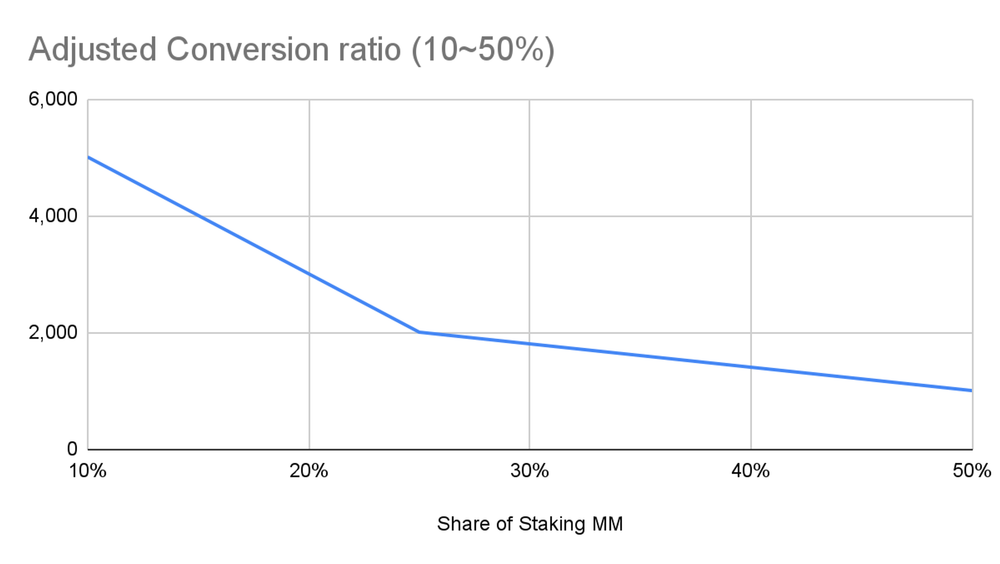
We got the exchange rate between $G ↔ MM. Let’s move on to check how the value of points will be calculated and changed by share.
5. Understanding expected return to simulate cost of mining point & token
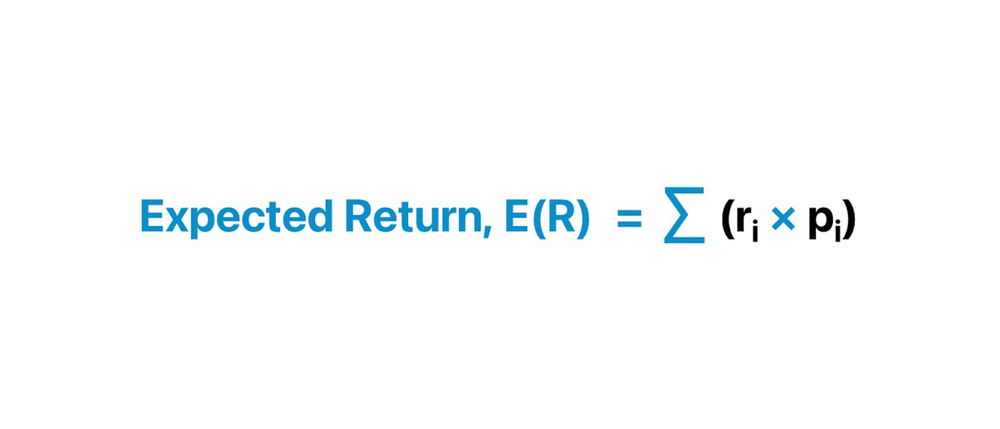
Deploying capital always incurs a cost, represented by the Expected Return. This is the anticipated profit or loss an investor can expect from an investment.
For instance, if you distribute $1000 across BNB, USDC, and USDT at a 3:1:1 ratio respectively, the expected return would be 20.05%.
- BNB: 21.51% APR based on Binance launchpool average APY 24% (compounded daily)
- USDT: 17.59% APR based on 3/6 Venus supply APY (compounded daily)
- USDC: 18.13% APR based on 3/6 Venus supply APY (compounded daily)
If there's a product with a higher APR, the expected return will be higher.

Staking at Gomble means that investors forego the certainty of fixed interest from other financial products, accepting the risks in pursuit of higher returns. Therefore, the expected return from staking at Gomble should exceed 20.05% (3.57% for a 65-day expected return). This can be considered the cost of capital.
This foregone expected return can be used to compute the mining cost per MM by using equation below.
Mining cost per MM = (TVL * expected return) / {(Total airdrop allocation * Share of staking points) * Conversion ratio}
Recently, Gomble reached a Total Value Locked (TVL) of $10M. Plugging this into the equation, The cost per MM will be $0.000009.

As total MM supply from staking is fixed, cost per MM is constant regardless of the share of staking MM reward. Cost per MM linearly increases as TVL grows like the graph below.

Therefore, staking early at the lower TVL, you will be able to farm MM at lower cost and more MM reward as MM is linearly distributed by the block.
Wow we calculated the cost of the MM! Is it done?
Of course not. Our ultimate goal is $G not MM. Calculating the mining cost of $G is simple like the equation below.
Mining cost of $G = Mining cost per MM * Conversion ratio
As conversion ratio changes by Share of Staking MM reward, your mining cost per $G is different unlike MM.
For example, if the share of staking MM reward is 10% of the total MM supply and TVL stays at 10M, cost per $G is $0.0446 and FDV of $G after launch should be above 44.6M to be profitable, otherwise, you cannot meet the cost of capital.

Let’s adjust the TVL to check how mining cost per MM, $G and FDV change at the range of 10~50% share.
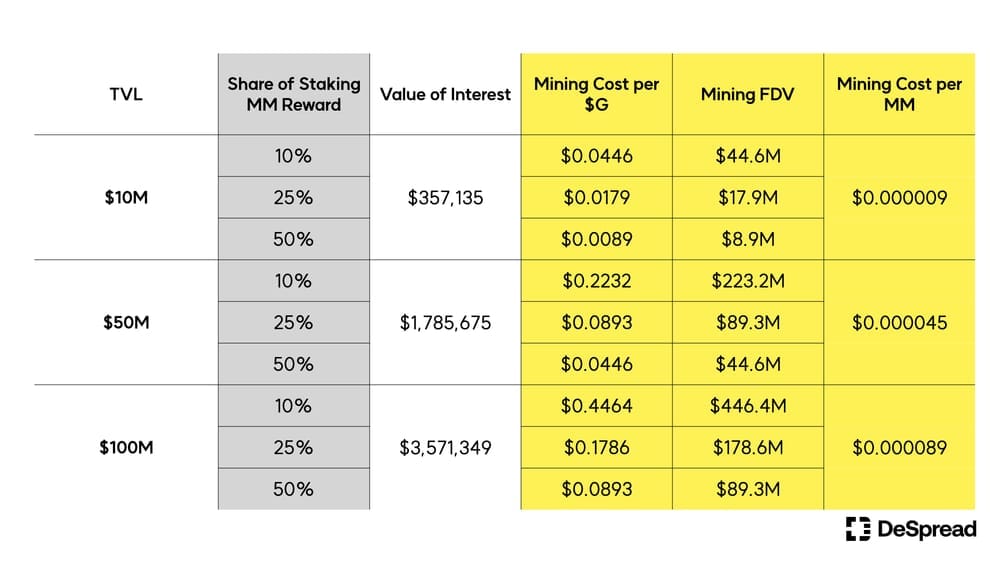
Unlike point where TVL is the only factor affecting the cost, cost per $G and FDV aren’t linear due to the conversion rate changed by share of staking MM reward.
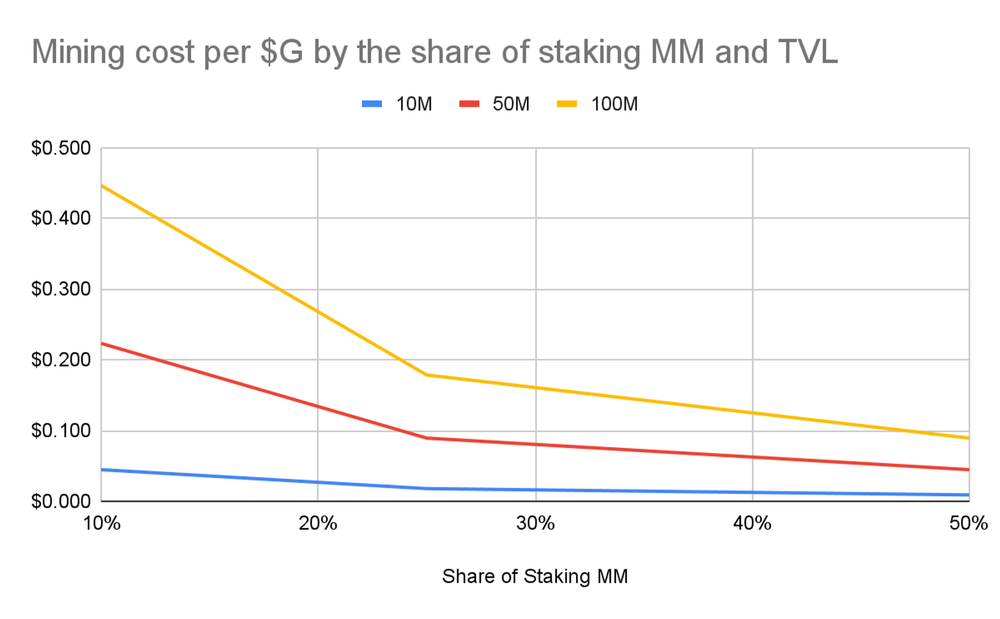
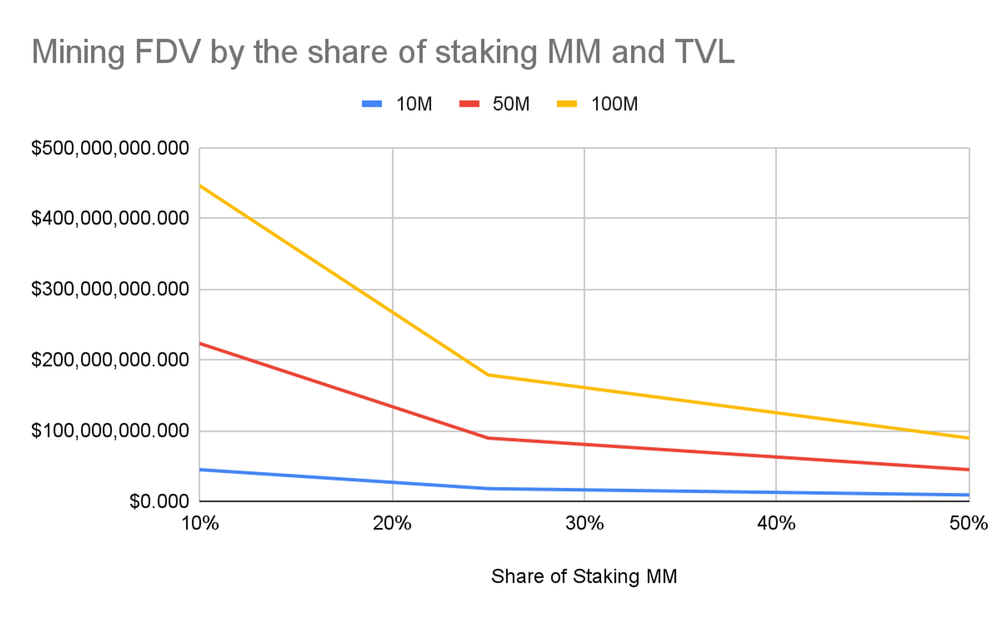
There's also an inflection point on the chart where mining cost of $G rises sharply and it’s more volatile as TVL grows.
Take away from this is that factors affecting the mining cost of $G are TVL and the total supply of MM. And total supply is inflated by the social mission. Which means that staking participants are automatically disadvantaged as more people participate in the social mission (Increase of total supply → Share decrease → Cost goes up).
Gomble’s point system design has the above risk for staking participants. To protect staking participants from being disadvantaged, the project should consider 1) controlling the total supply, 2) creating a sink to consume points, and 3) increasing MM allocation for staking.
Controlling the total supply is almost impossible as it’s hard for the project to give up the social hype. Therefore, options 2 and 3 should be considered to increase staking TVL.
6. Create scenario of ROI based on FDV of benchmark projects
If Gomble achieves 100 million TVL and 5% staking point share, mining FDV of $G would be $892 million, similar to Shrapnel's current FDV. So, is it worth mining $G with a fully diluted value (FDV) of $892 million?
This is why we need to use benchmark projects to create a scenario and decide if participation is worthwhile.
Gomble, a Strategic Casual Game Studio, is backed by Binance Labs. Therefore, we should use Binance Labs' portfolio gaming projects and listed projects as the target FDV for Gomble at launch. The FDV is based on the CoinMarketCap (CMC) data as of March 7.
- Fusionist ($ACE) - Binance Labs backed, Binance listed
- FDV : $1.89B
- Sleepless AI ($AI) - Binance Labs backed, Binance listed
- FDV : $2.15B
- Shrapnel ($SHRAP) - Binance listed
- FDV : $872M
- Bigtime ($BIGTIME) - Binance listed
- FDV : $2.32B
- Portal ($PORTAL) - Binance listed
- FDV : $2.19B
Next, choose 3 projects to create bullish, neutral, bearish scenario and calculate target price of $G.
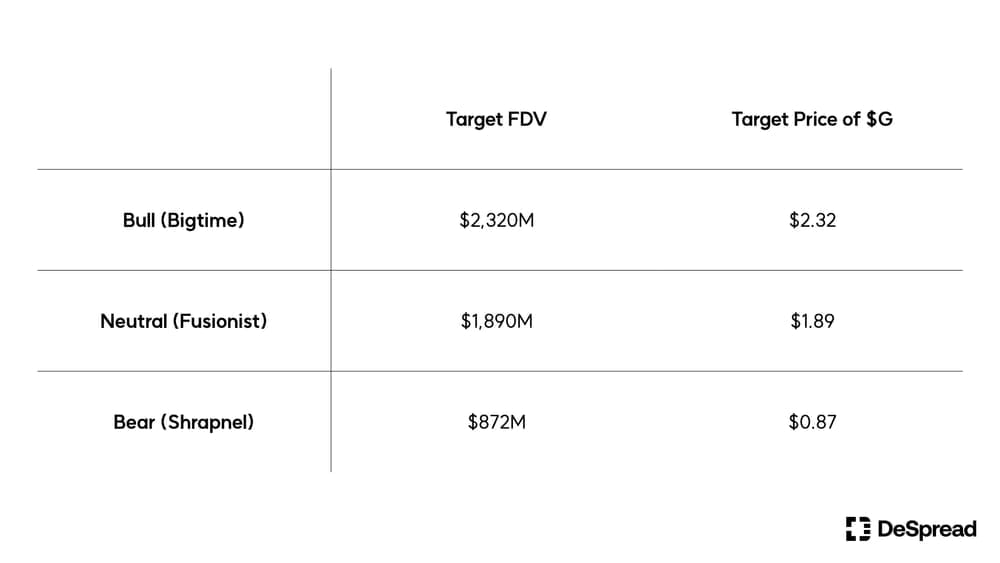
Use the mining cost of $G by TVL to calculate ROI. Here are two ROI cases with varying TVLs and scenarios..
Case 1 : Share of MM is 1% where it’s extremely sybil attacked. We can see a negative ROI scenario here which means that you are farming tokens more expensive than target price and win rate is low if you assume that TVL will grow in the future.
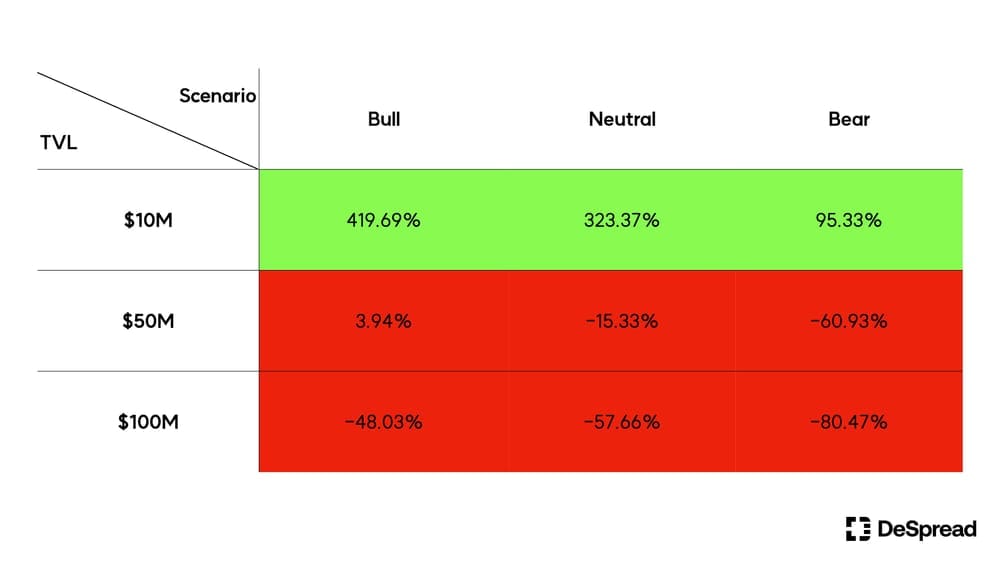
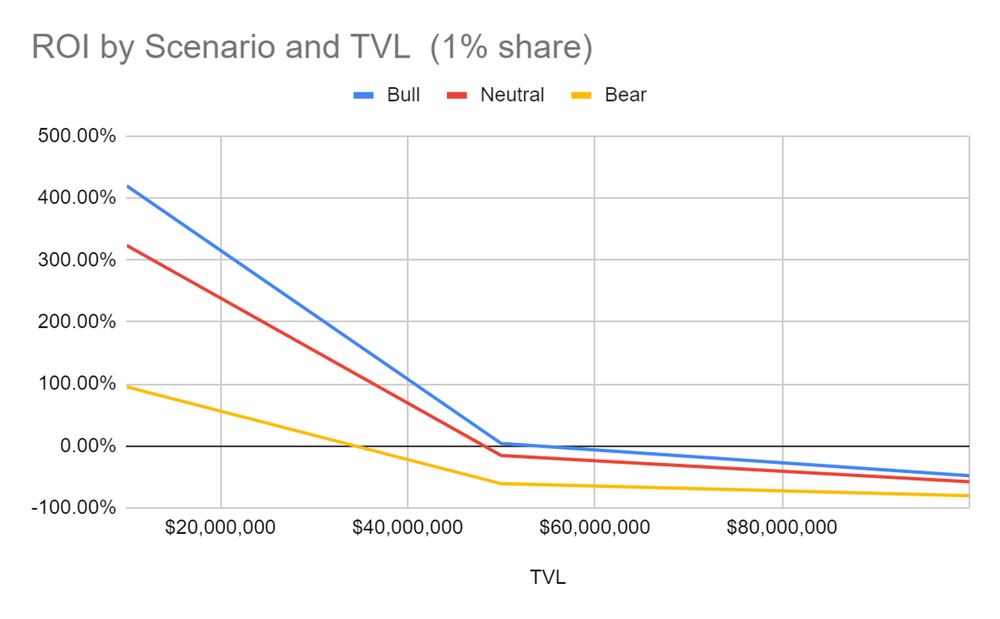
Case 2 : Share of Staking MM is 40% where share of MM is at a positive point. You will get a high return in every scenario.
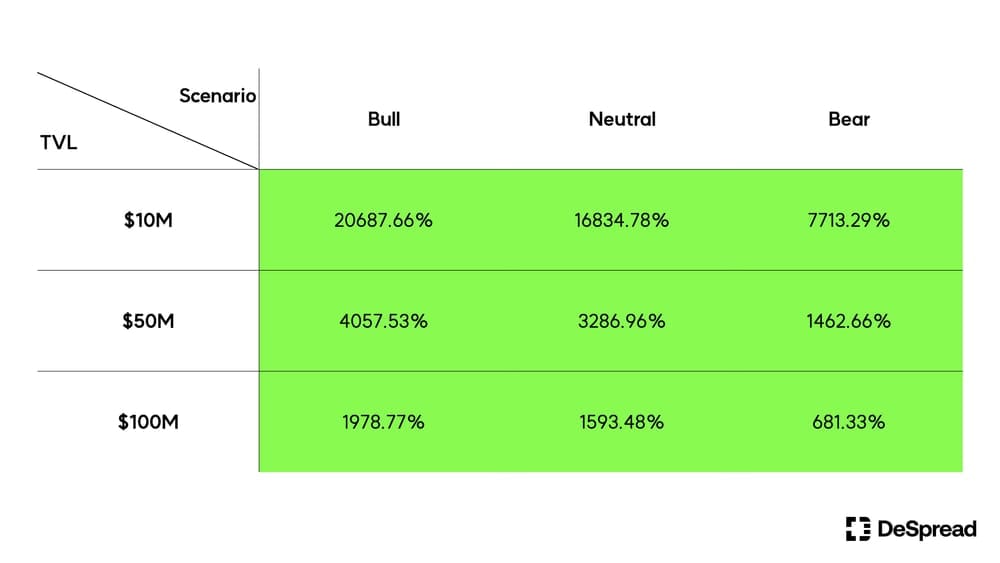
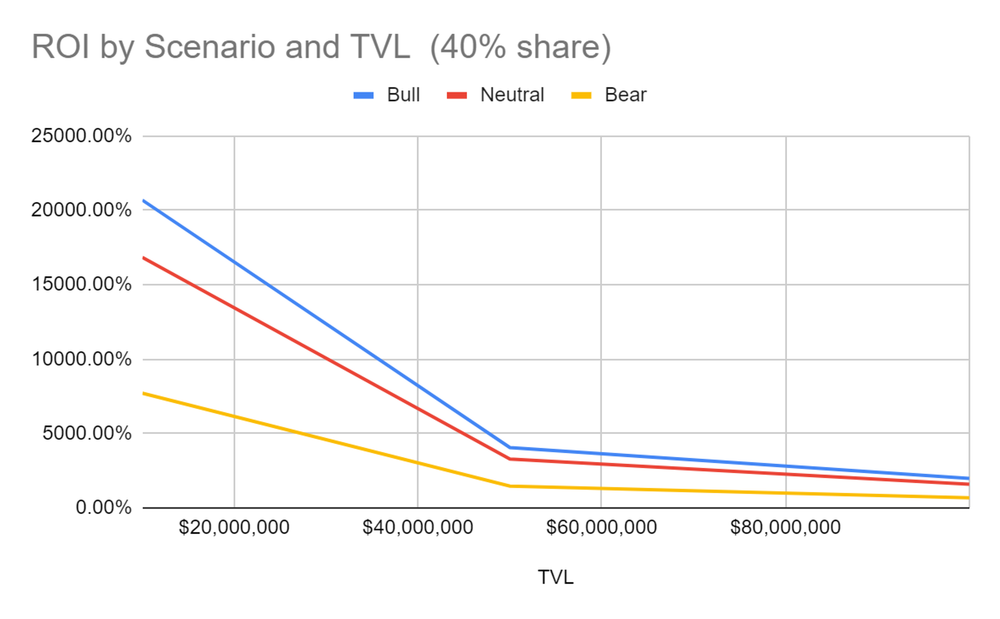
ROI differs by share of staking MM rewards and TVL where setting up your own benchmark project and scenario will help you make better decisions.
7. Wrapping up
Calculating the value of a point alone isn't sufficient. It's crucial to understand the cost and FDV where you are farming and to create scenarios for decision-making. Understanding the point system and creating a framework will help you to make a decision in the following situations.
- Decide whether it’s worth staking → Calculate mining cost of token & point and create scenario using benchmark project
- Decide when to stop staking → Calculate the breakeven TVL by using the cost of capital or own expected return
- Pre-market valuation → Consider the mining cost of staking.
For those who successfully read this article, I’ve attached a spreadsheet template which can be used to calculate the overall process of this article. Hope it will help for your smarter airdrop strategy for investors and projects running an airdrop campaign!
Point Valuation Framework by wisekim