Pendle Finance — Discovering Unexplored Trading Market
Focusing on Principles and Growth Potential

0. Introduction
By creating an interest rate swap market utilizing on-chain Strip, Pendle Finance has pioneered a new trading market and is exploding with growth, fueled by the LSD and RWA narratives. In this article, we'll explore how Pendle Finance works, its tokenomics, growth potential, and limitations.
1. How Pendle Finance Works
1.1. On-Chain Strip
In DeFi, assets that generate cash flows are called yield-bearing tokens (ybtokens). These tokens can be categorized into three types according to how interest is accumulated.
- Rebase Model: A model in which the token balance increases (e.g. $stETH (Lido), $aUSDC (Aave))
- Yield Bearing Model: A model in which the exchange rate increases relative to the underlying asset (e.g. $rETH (Rocket Pool), $gDAI (Gains Network))
- Interest Paying Model: A model that pays interest on a blue-chip asset ($ETH) (e.g. $GLP (GMX), $LOOKS (LooksRare))
In Pendle Finance, all of these different ybtokens are wrapped in a single token standard (SY) with a fixed expiration date. The SY token (SYT) is then split into one principal token (PT) and one yield token (YT).
- 1 SY-stETH = 1 PT-stETH + 1 YT-stETH
- SYT, PT, and YT can be freely swapped before the expiration date
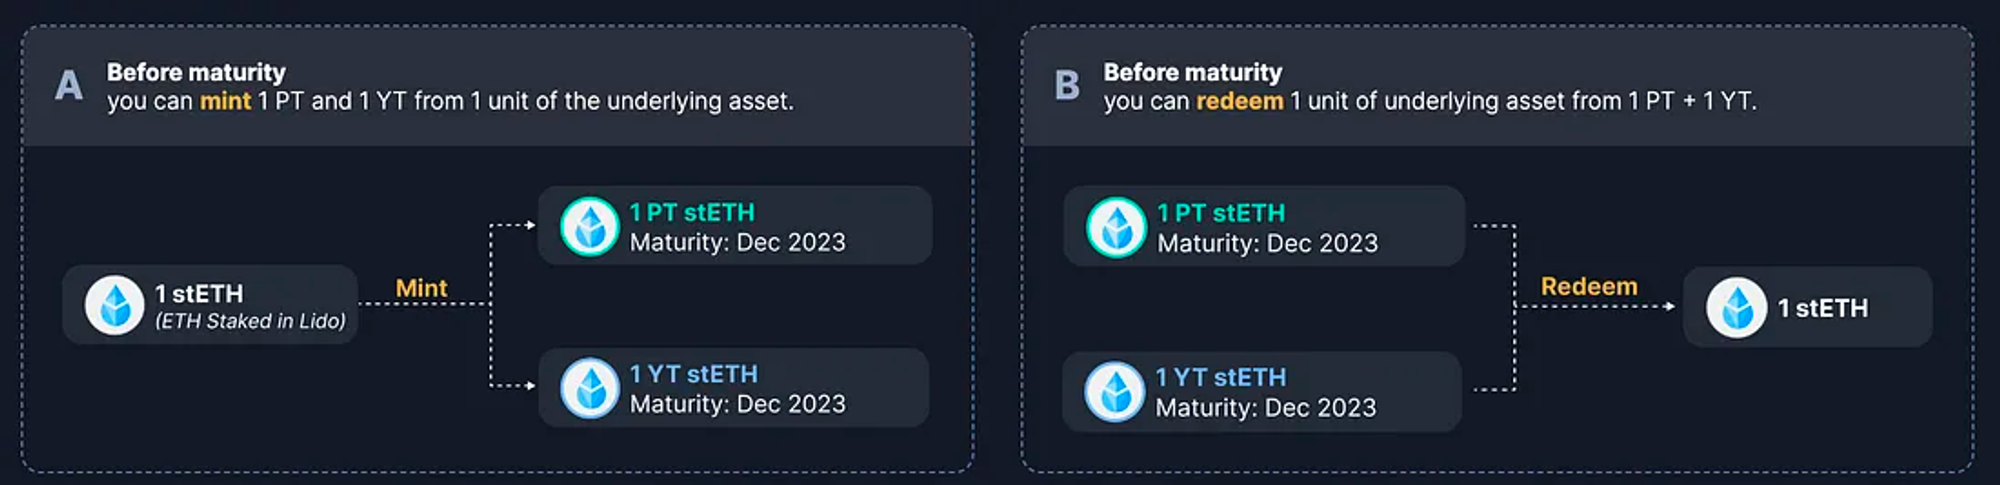
The relationship between the three tokens can be easily understood through the concept of coupon stripping in traditional finance. This concept can be applied to Pendle Finance's SY, PT, and YT by separating the interest from the principal of a bond with a coupon so that they can be traded as separate financial instruments.
- SYT: Coupon bond
- PT: Zero-Coupon bond
- YT: The total amount of coupons received until maturity.
However, unlike typical bonds that have a fixed coupon rate at the time of issuance, SY has a floating coupon rate, which is affected by the amount of CL (Consensus Layer) and EL (Execution Layer) rewards on the Ethereum mainnet. In traditional finance, there are bonds with a floating coupon rate, such as FRN (Floating-Rate Note). However, there is no such product that changes the coupon rate in near real-time like SY, making it a unique product that can only be experienced in blockchain-based finance.
1.2. Correlation Between PT and YT
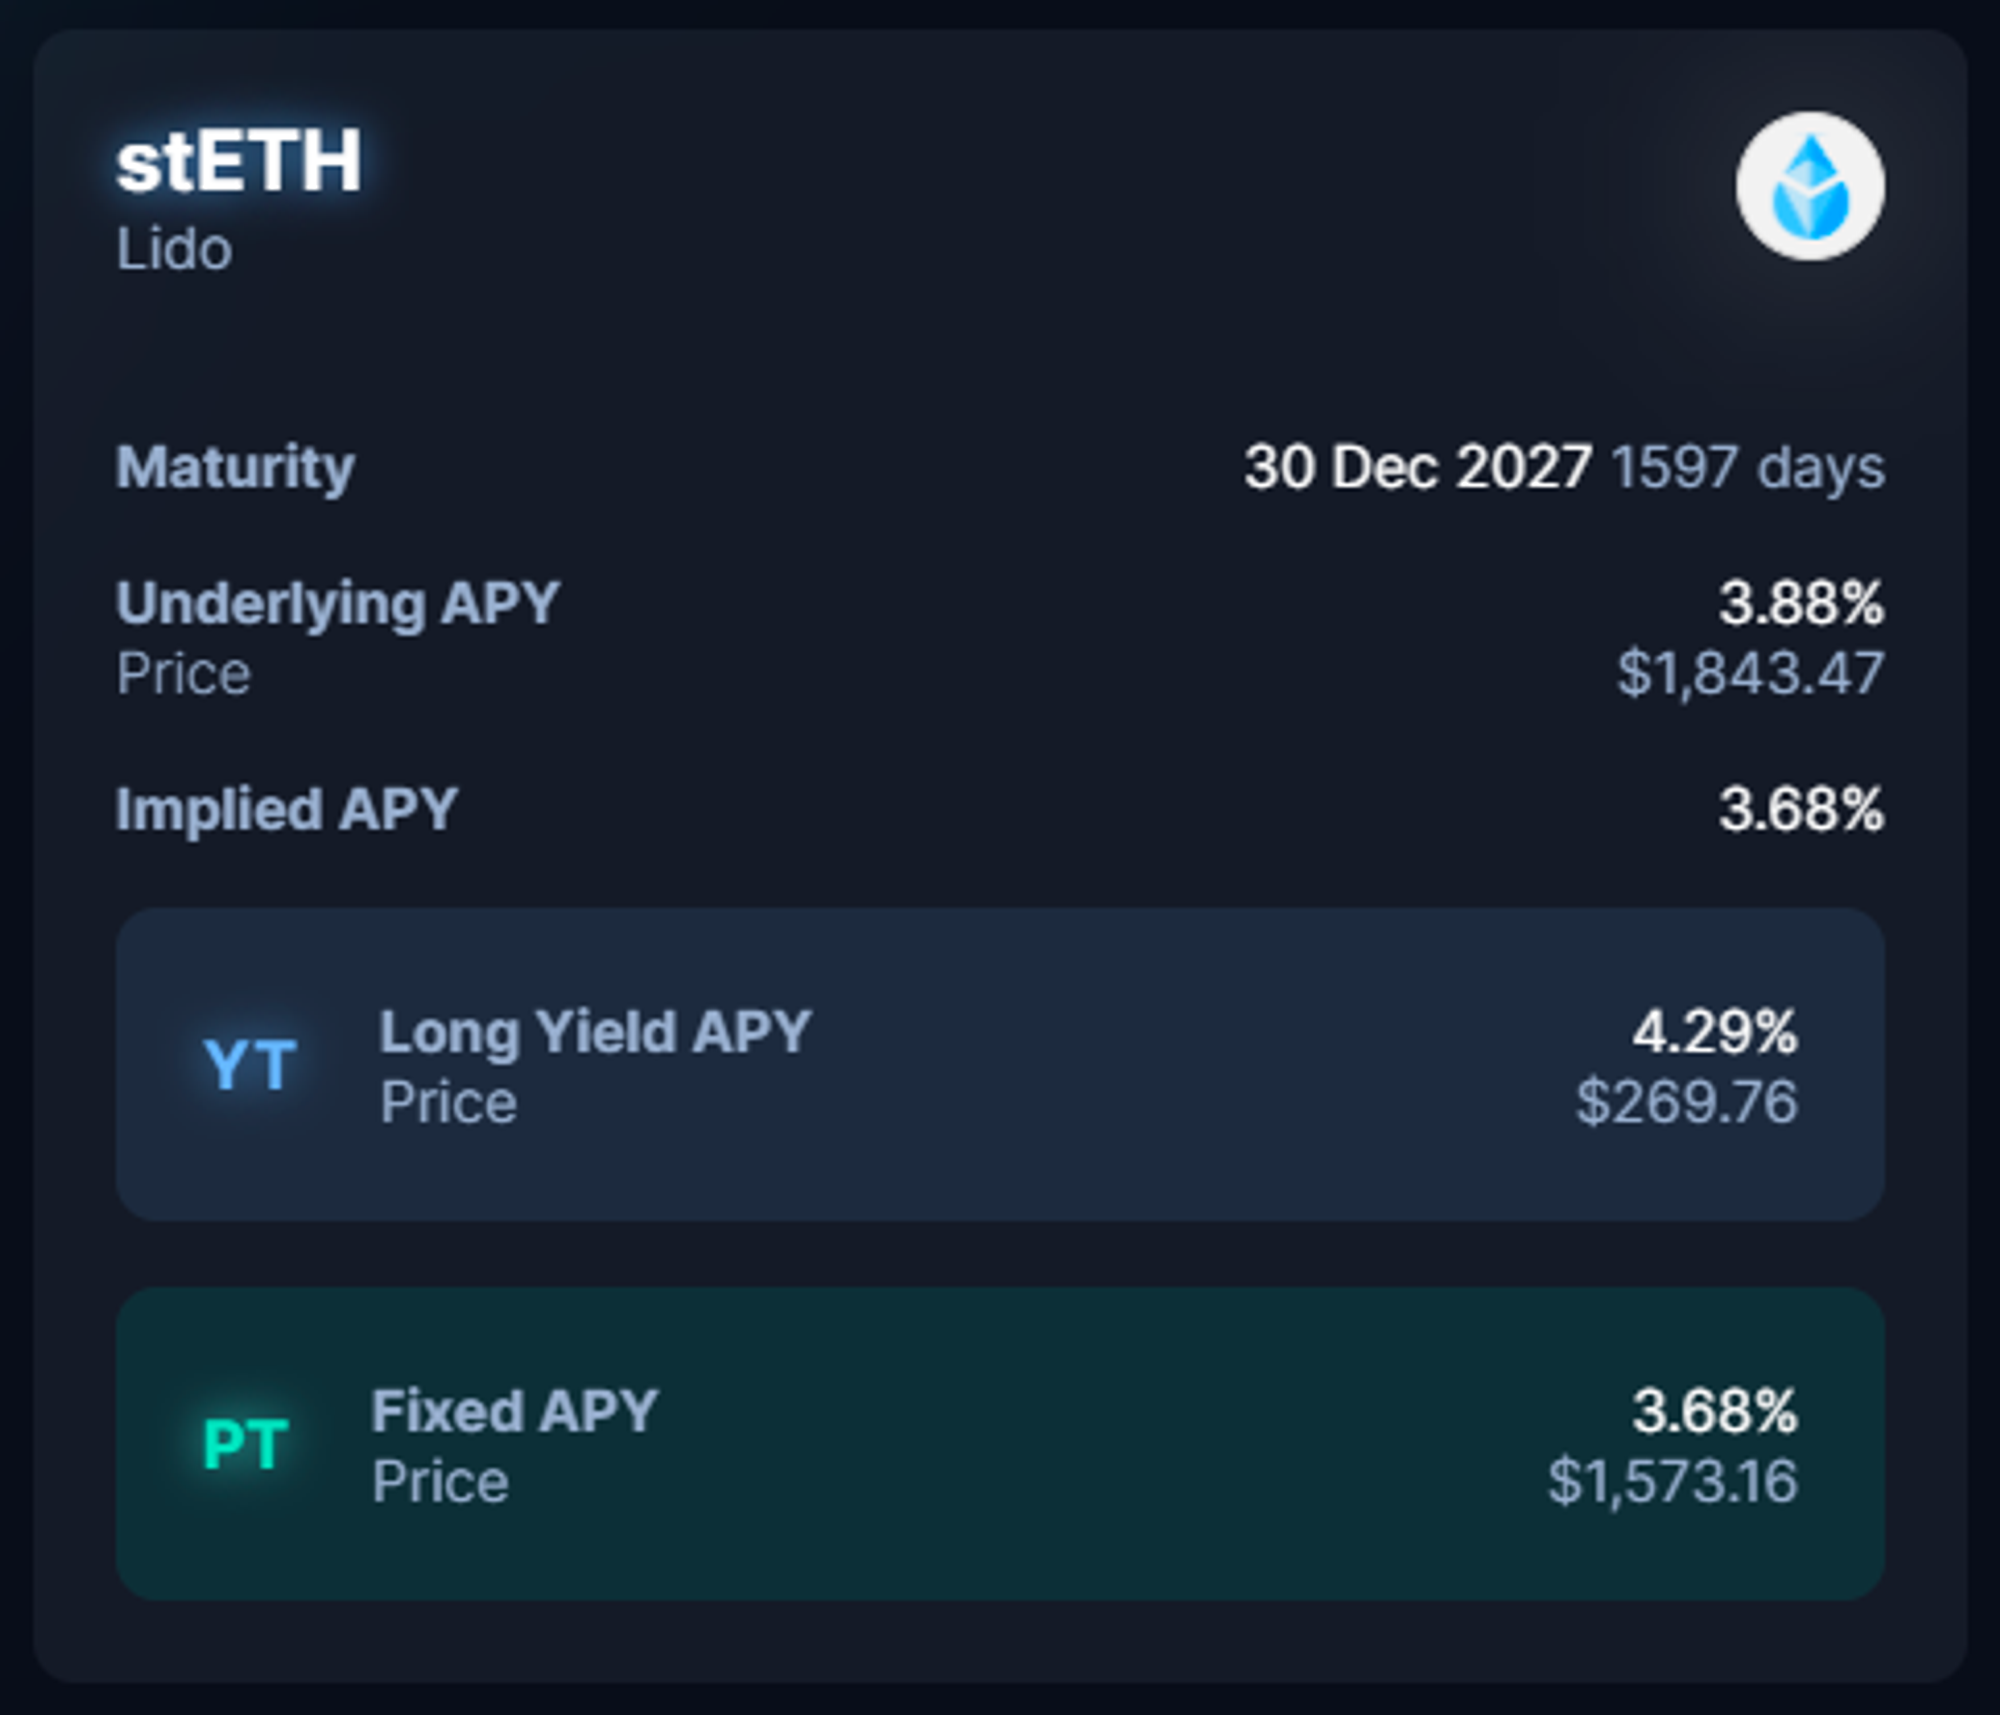
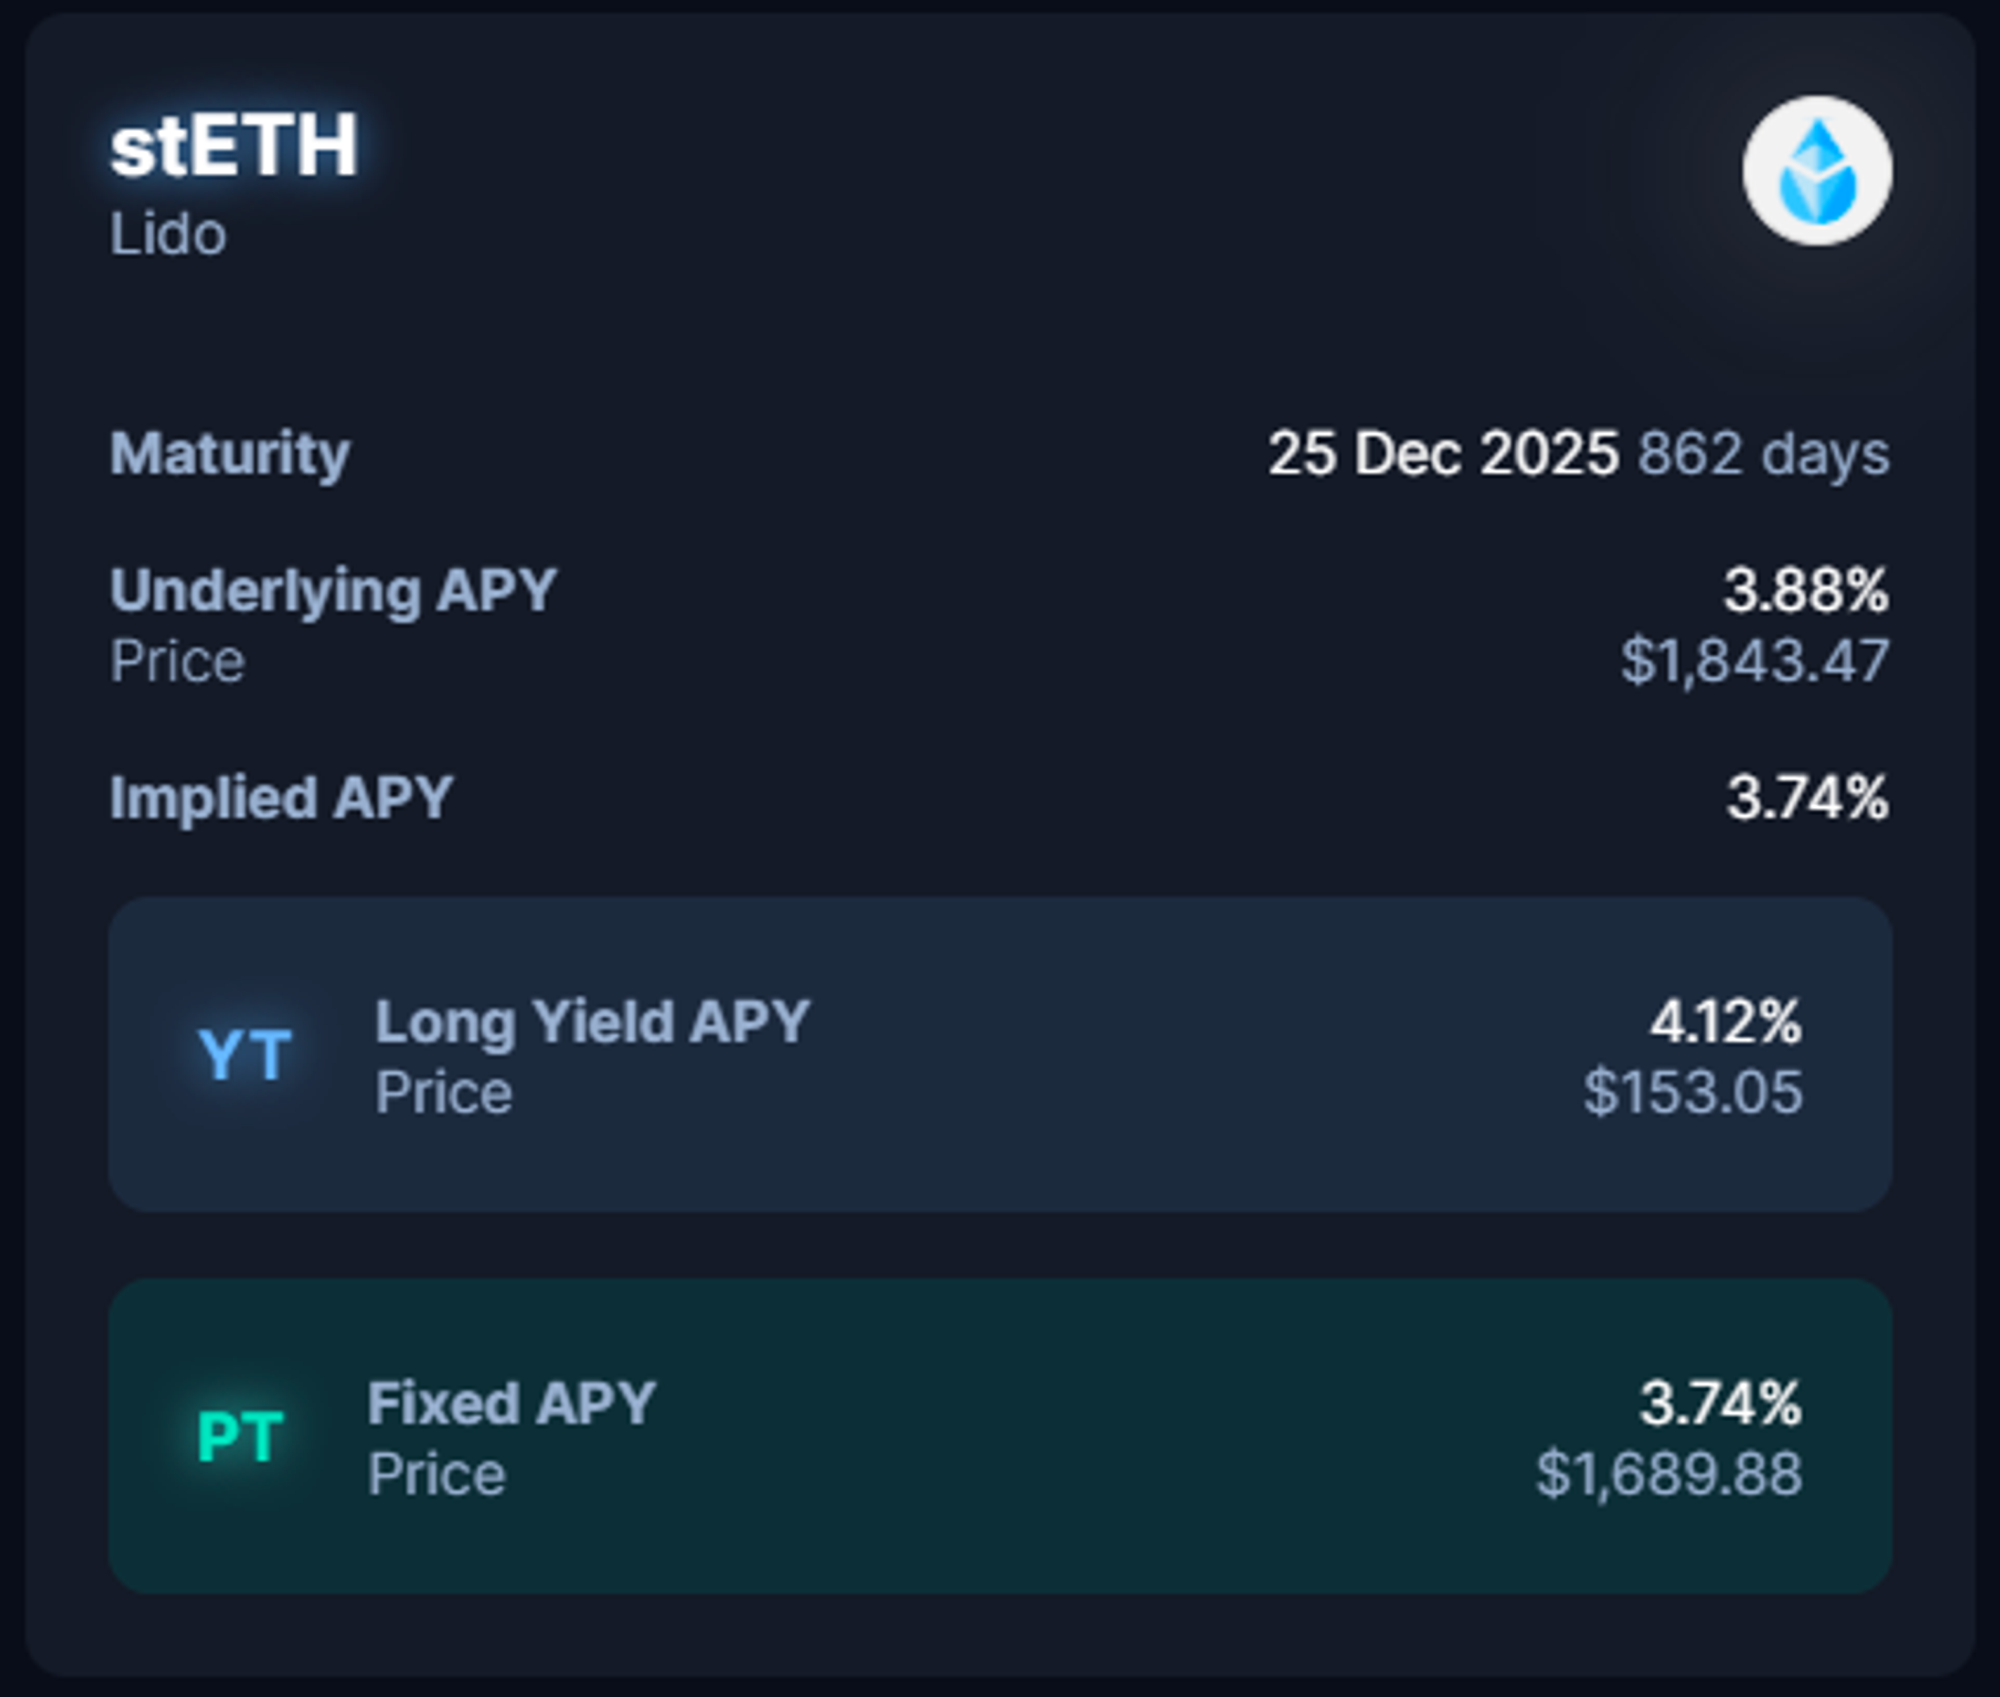
PT is the present value of SY discounted to the current coupon rate, and YT is the present value of the sum of the coupons that SY will receive until its maturity, also discounted to the current coupon rate. Therefore, the longer the time left to maturity, the more the amount of coupons will be received, causing the price of YT to increase. Whereas the price of PT will decrease as more discounting is required to bring it to present value. The same logic applies when maturity is about to come due, causing the price of YT to fall and the price of PT to rise.
This also means that for the same underlying asset, PT and YT can have different prices if they have different maturities. In fact, as shown in the figure below, we can see that PT and YT are different for ETH bonds with different maturities: the longer the maturity, the larger the value of YT and the smaller the value of PT. However, even if the bonds have different maturities, the sum of PT and YT should match if the underlying asset is the same.
1.3. PT, YT Price Discovery: Implied APY
As the market interest rate changes, the price of the bond will change in response. Higher interest rates will cause the price of the bond to decrease (increasing the yield) and lower interest rates will cause the price to increase (decreasing the yield). In a similar way, PT and YT will change in price in response to the ybtoken's interest rate, with PT's price decreasing (YT's price increasing) when interest rates increase and PT's price increasing (YT's price decreasing) when interest rates decrease.
In this case, Pendle Finance uses two interest rates. They are named Underlying APY (U.APY) and Implied APY (I.APY). The U.APY is the interest rate that the ybtoken actually receives from the Dapp and represents the yield that YT holders can expect until the maturity. I.APY, on the other hand, is a value derived from the price of PT and YT and is the interest rate the market expects ybtoken to earn.
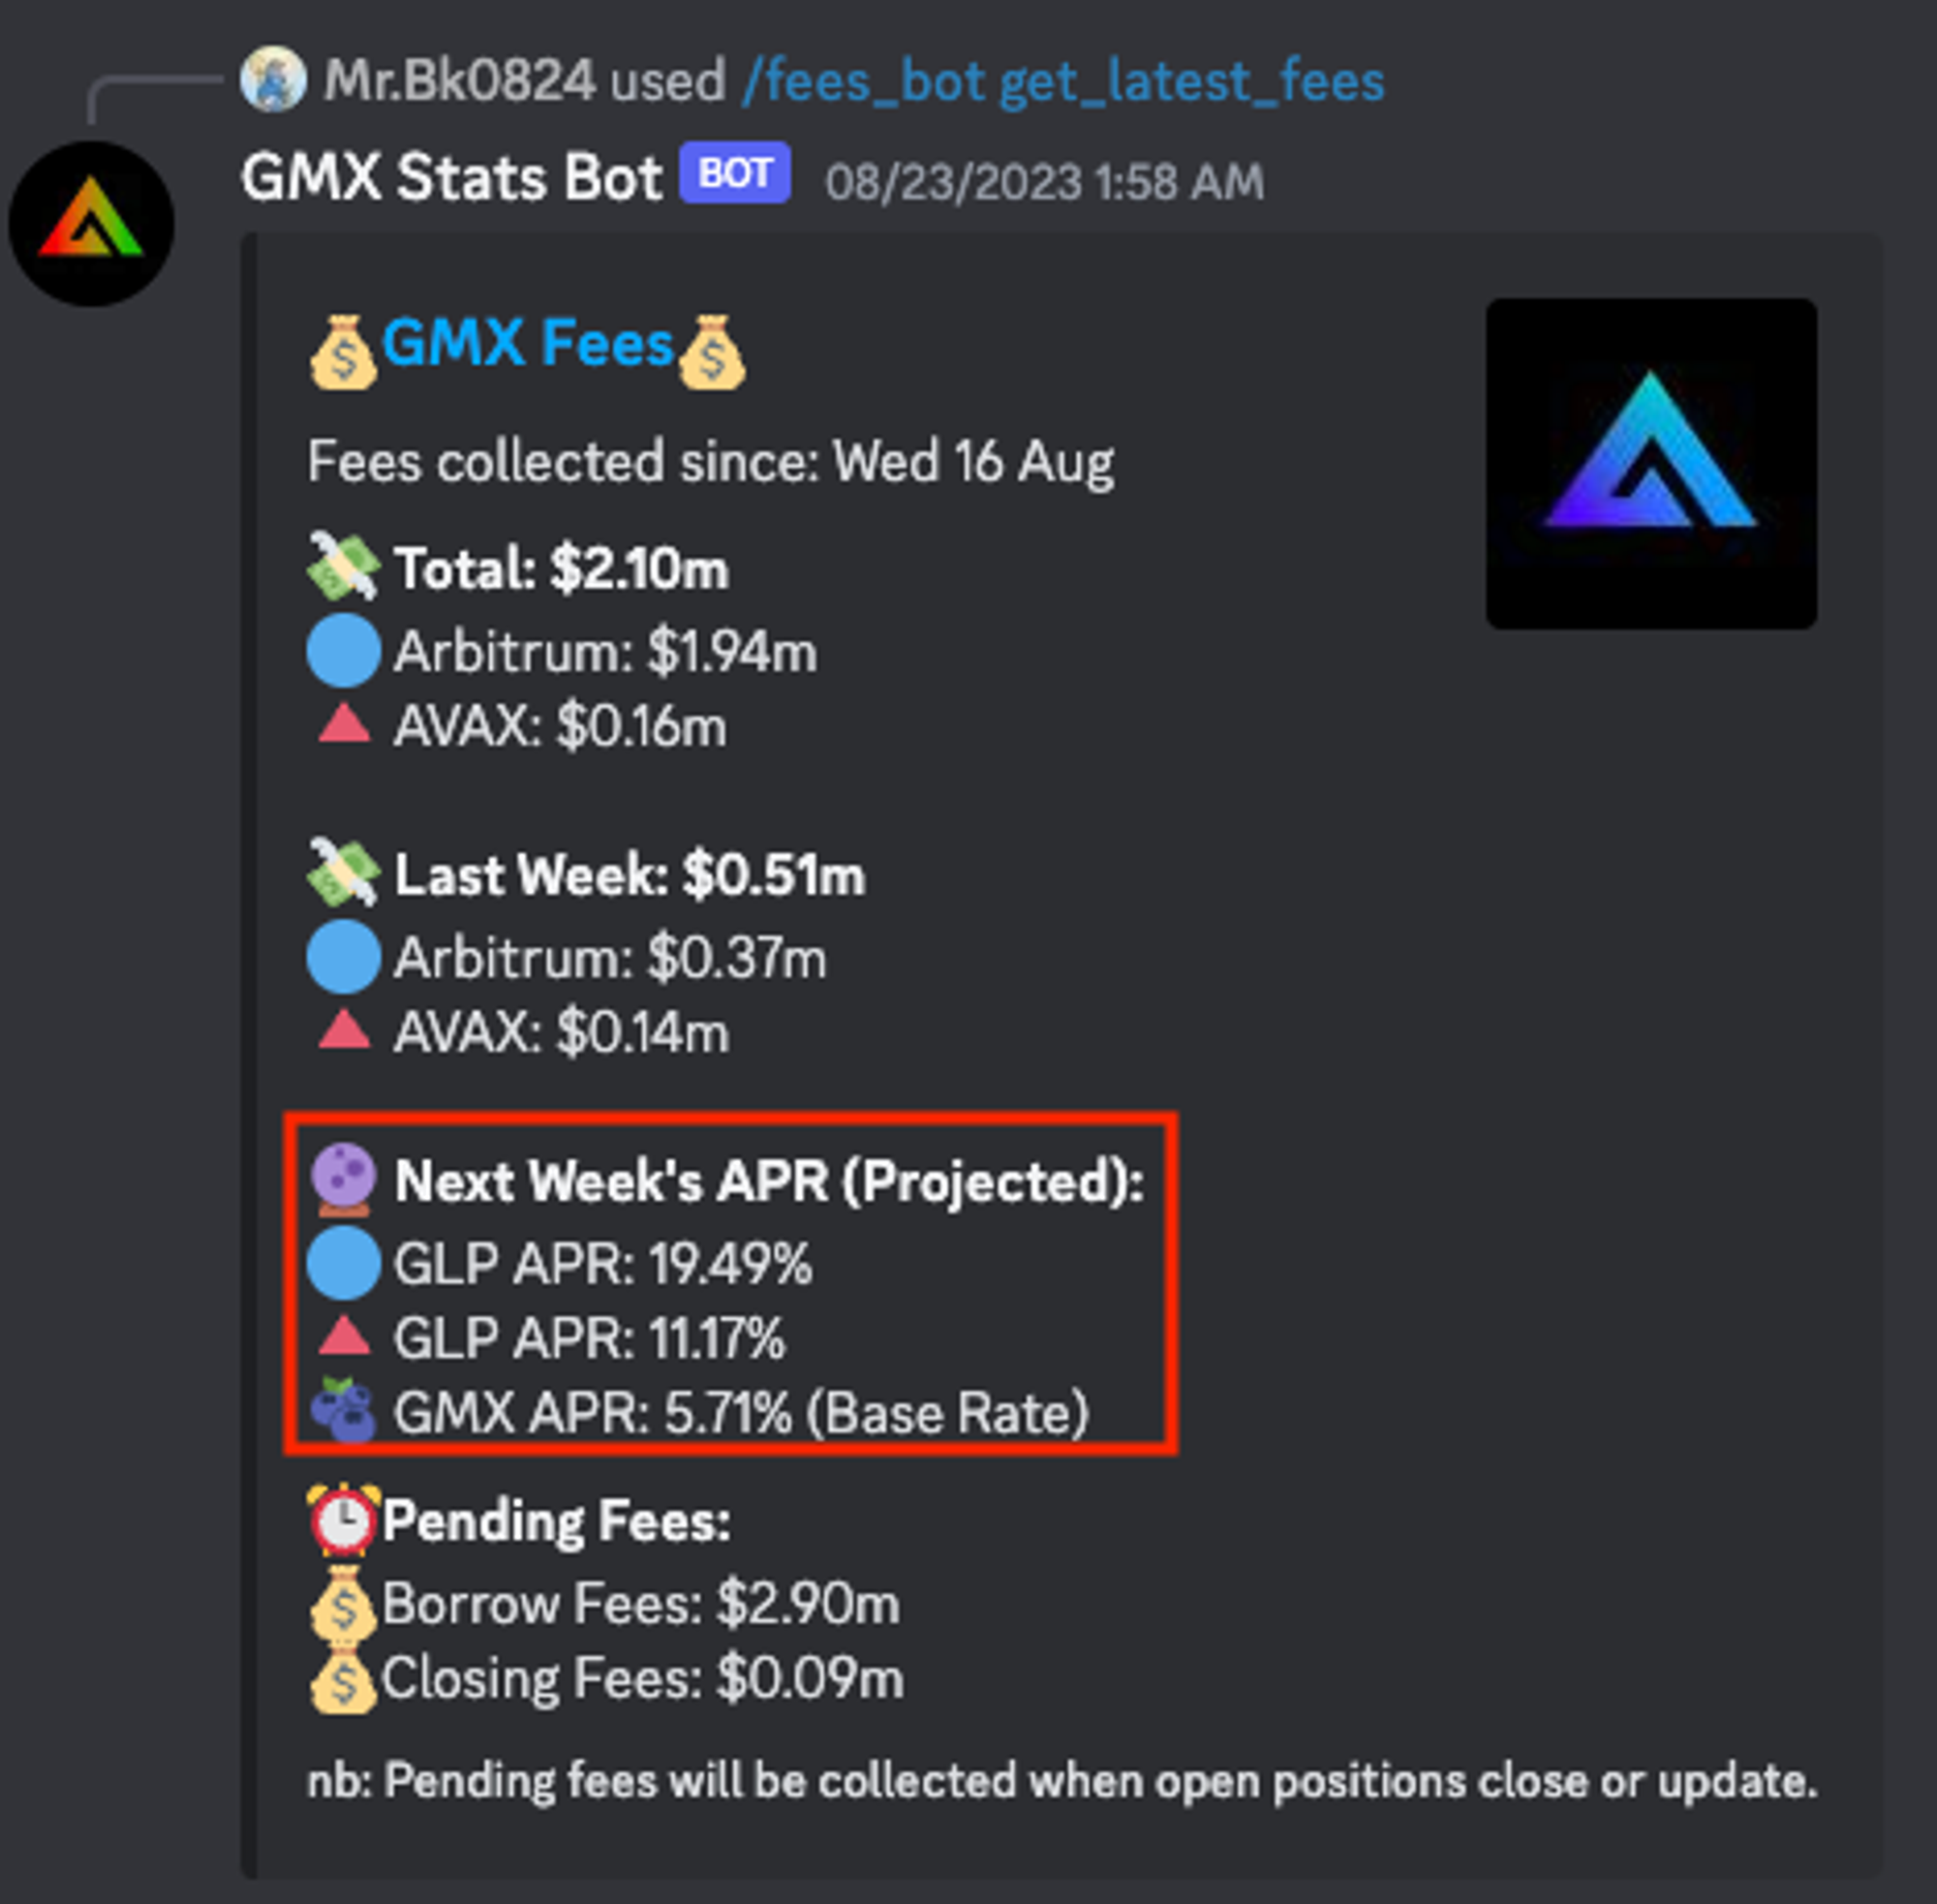
In most cases, U.APY and I.APY will differ because of the speed at which U.APY is updated and the speed at which the market absorbs the information and makes a judgment call. For example, for $GLP (GMX's LP token), platform fees collected during one week will be updated to the $GLP APR the following week, giving investors a chance to make an informed decision before the U.APY is actually adjusted.
As these indicators influence the judgment of investors and are reflected in the I.APY, the I.APY reacts to information faster than the U.APY, resulting in a divergence between the two values. Let's break down the cases where the two values diverge and look at the factors to consider when investing with examples.
1.4. Implied APY ≠ Underlying APY
[ U.APY ≈ I.APY ]
This is a situation where the market assesses that the interest rate that ybtoken actually generates is at a decent level, making it relatively difficult to make arbitrage compared to other cases.
[ U.APY > I.APY ]
This situation can be divided into 1) when I.APY is undervalued in the market for some reason, and 2) when U.APY is relatively overvalued in the market.
1) When I.APY is undervalued
This is the view that the U.APY of an interest-generating Dapp (e.g., Gains Network) is fairly valued, but the I.APY is undervalued for some reasons, and the I.APY will rise. Believing that I.APY has room to rise means that YT is undervalued at this point, which in turn implies that PT is overvalued. This opens up a window of opportunity for PT holders to realize profits, and for investors who want to buy YT, it is an opportunity to invest in YT at a lower price than usual.
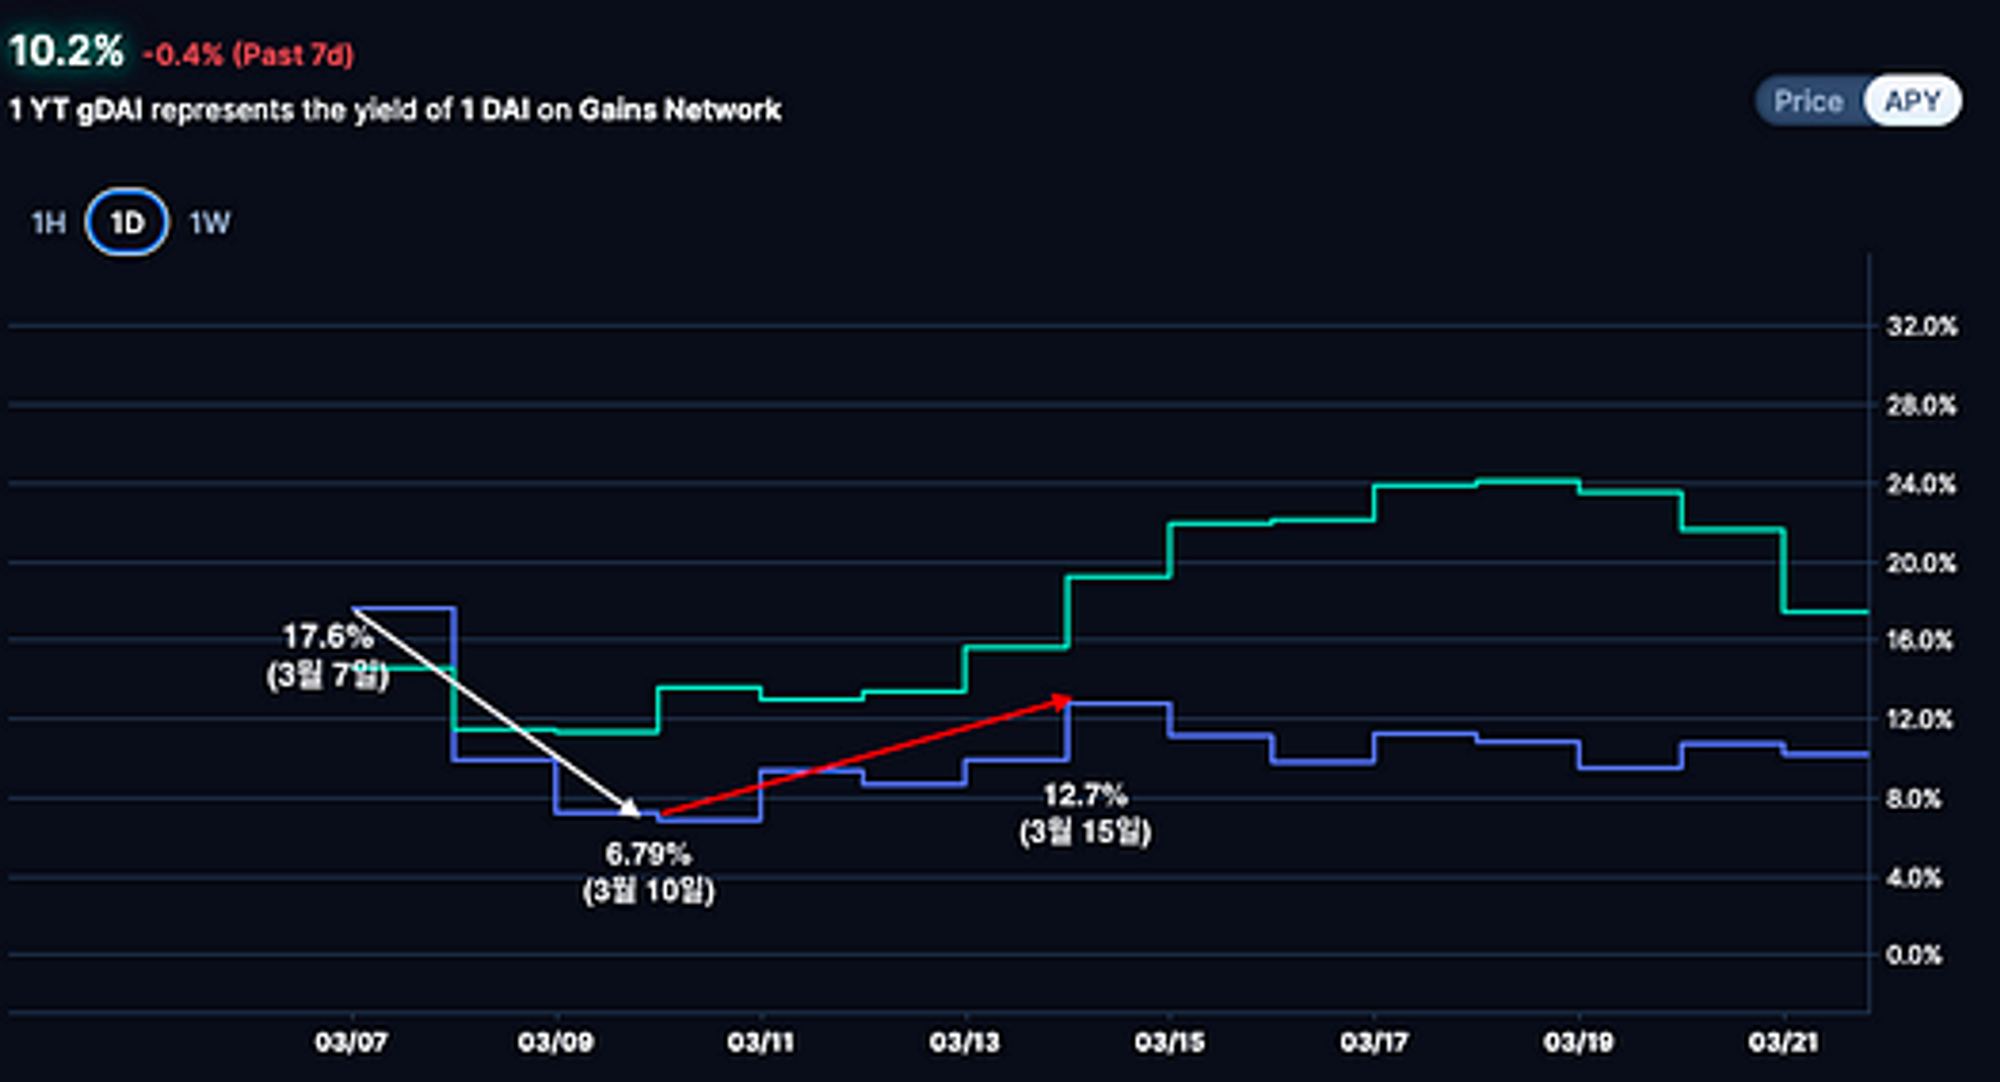
- Green Line: U.APY | Purple Line: I.APY
For example, an investor who bought PT on March 7 in the gDAI-28MAR2024 market as shown above could sell PT-gDAI on March 10, when I.APY dropped significantly, and take profit. A quick calculation shows that on March 7, the I.APY would have been around $0.84 at a discount of 17.6%, and on March 10, it would have been around $0.93 at a discount of 6.79%. If the investor bought 10,000 PT at $8,400 on March 7, they could sell 10,000 PT at $9,300 on March 10 and receive a profit of $900 (ROI ≈ 10.7% (900/8400)).
Furthermore, an investor who bought YT-gDAI on March 10 could have sold YT-gDAI on March 15, when the I.APY increased significantly, and realized a profit. Again, simple math shows that YT-gDAI would have been around $0.07 on March 10 (PT was around $0.93 at that point) and around $0.12 on March 15. If an investor bought 100,000 YT-gDAI on March 10 for $7,000, they could sell 100,000 YT-gDAI on March 15 for $120,000 and receive a profit of $5,000 (ROI ≈ 71.4% (5000/7000)).
2) When U.APY is relatively overvalued
In this case, the market consensus is that the U.APY of an interest-generating Dapp is too high and that the Dapp's growth will slow or decline.
Therefore, investors who expect the U.APY to continue to decline and fall further than the I.APY before the bond (e.g. gDAI-28MAR2024) matures may choose a strategy of buying PT to lock in a fixed rate (buying PT-gDAI).
For example, the gDAI-28MAR2024 bond had a U.APY of 24.1% and an I.APY of 10.8% on 3/18/2023, which was a pretty big gap.
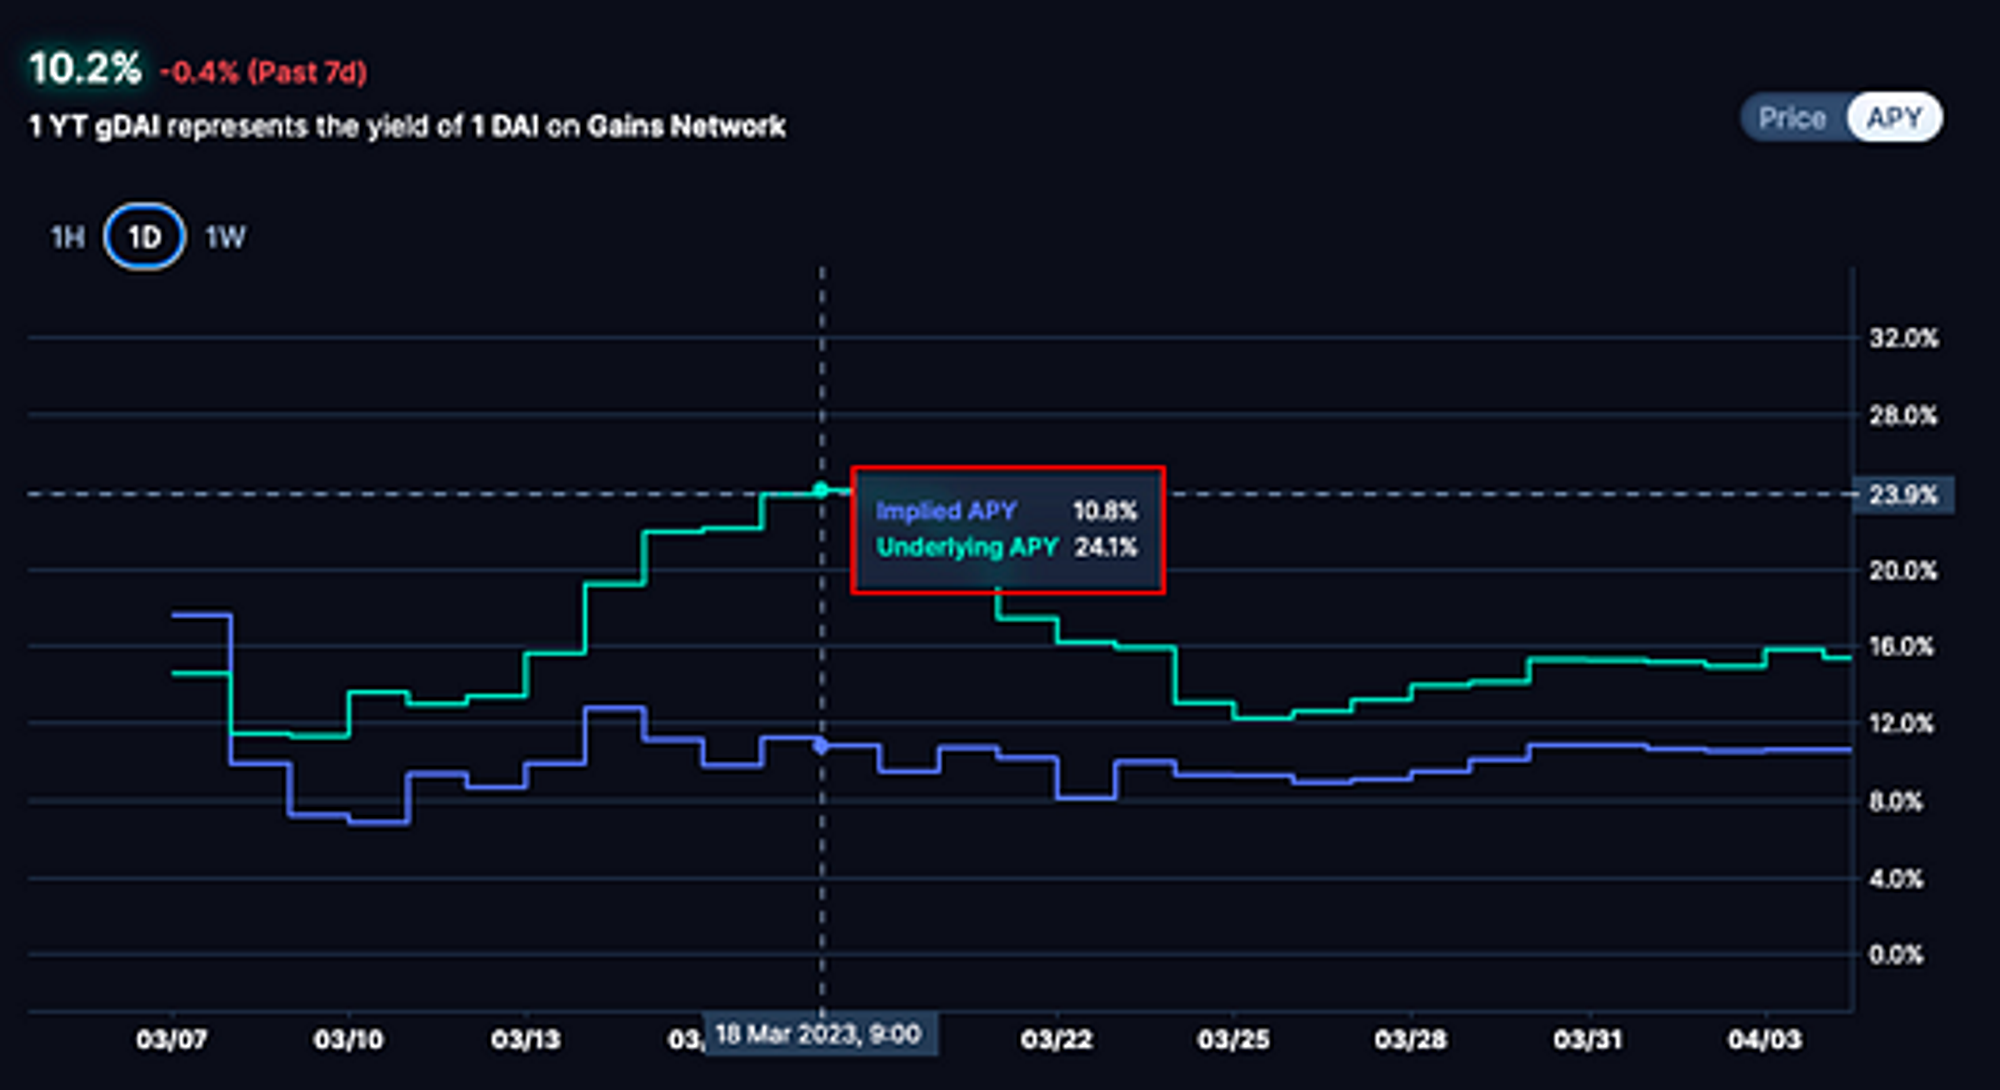
However, at this point, with the U.APY down below 5% and the I.APY at 8.5%, those who purchased PT on March 18 with a 10.8% fixed rate will be able to secure a return until the bond matures at an above-the-market rate.
[ U.APY < I.APY ]
It's the opposite of [ U.APY > I.APY ]. This can be categorized into two situations: 3) I.APY is overvalued in the market for some reasons, and 4) U.APY is relatively undervalued in the market.
3) When I.APY is overvalued
This is the view that the U.APY of an interest-generating Dapp (e.g., Gains Network) is fairly valued, but the I.APY is overvalued for some reasons, and the I.APY will decrease. Believing that I.APY has room to fall means that PT is undervalued at this point, which in turn implies that YT is overvalued. Therefore, investors who hold YT have an opportunity to take profits and investors who want to buy PT have an opportunity to invest in PT at a lower price than usual.
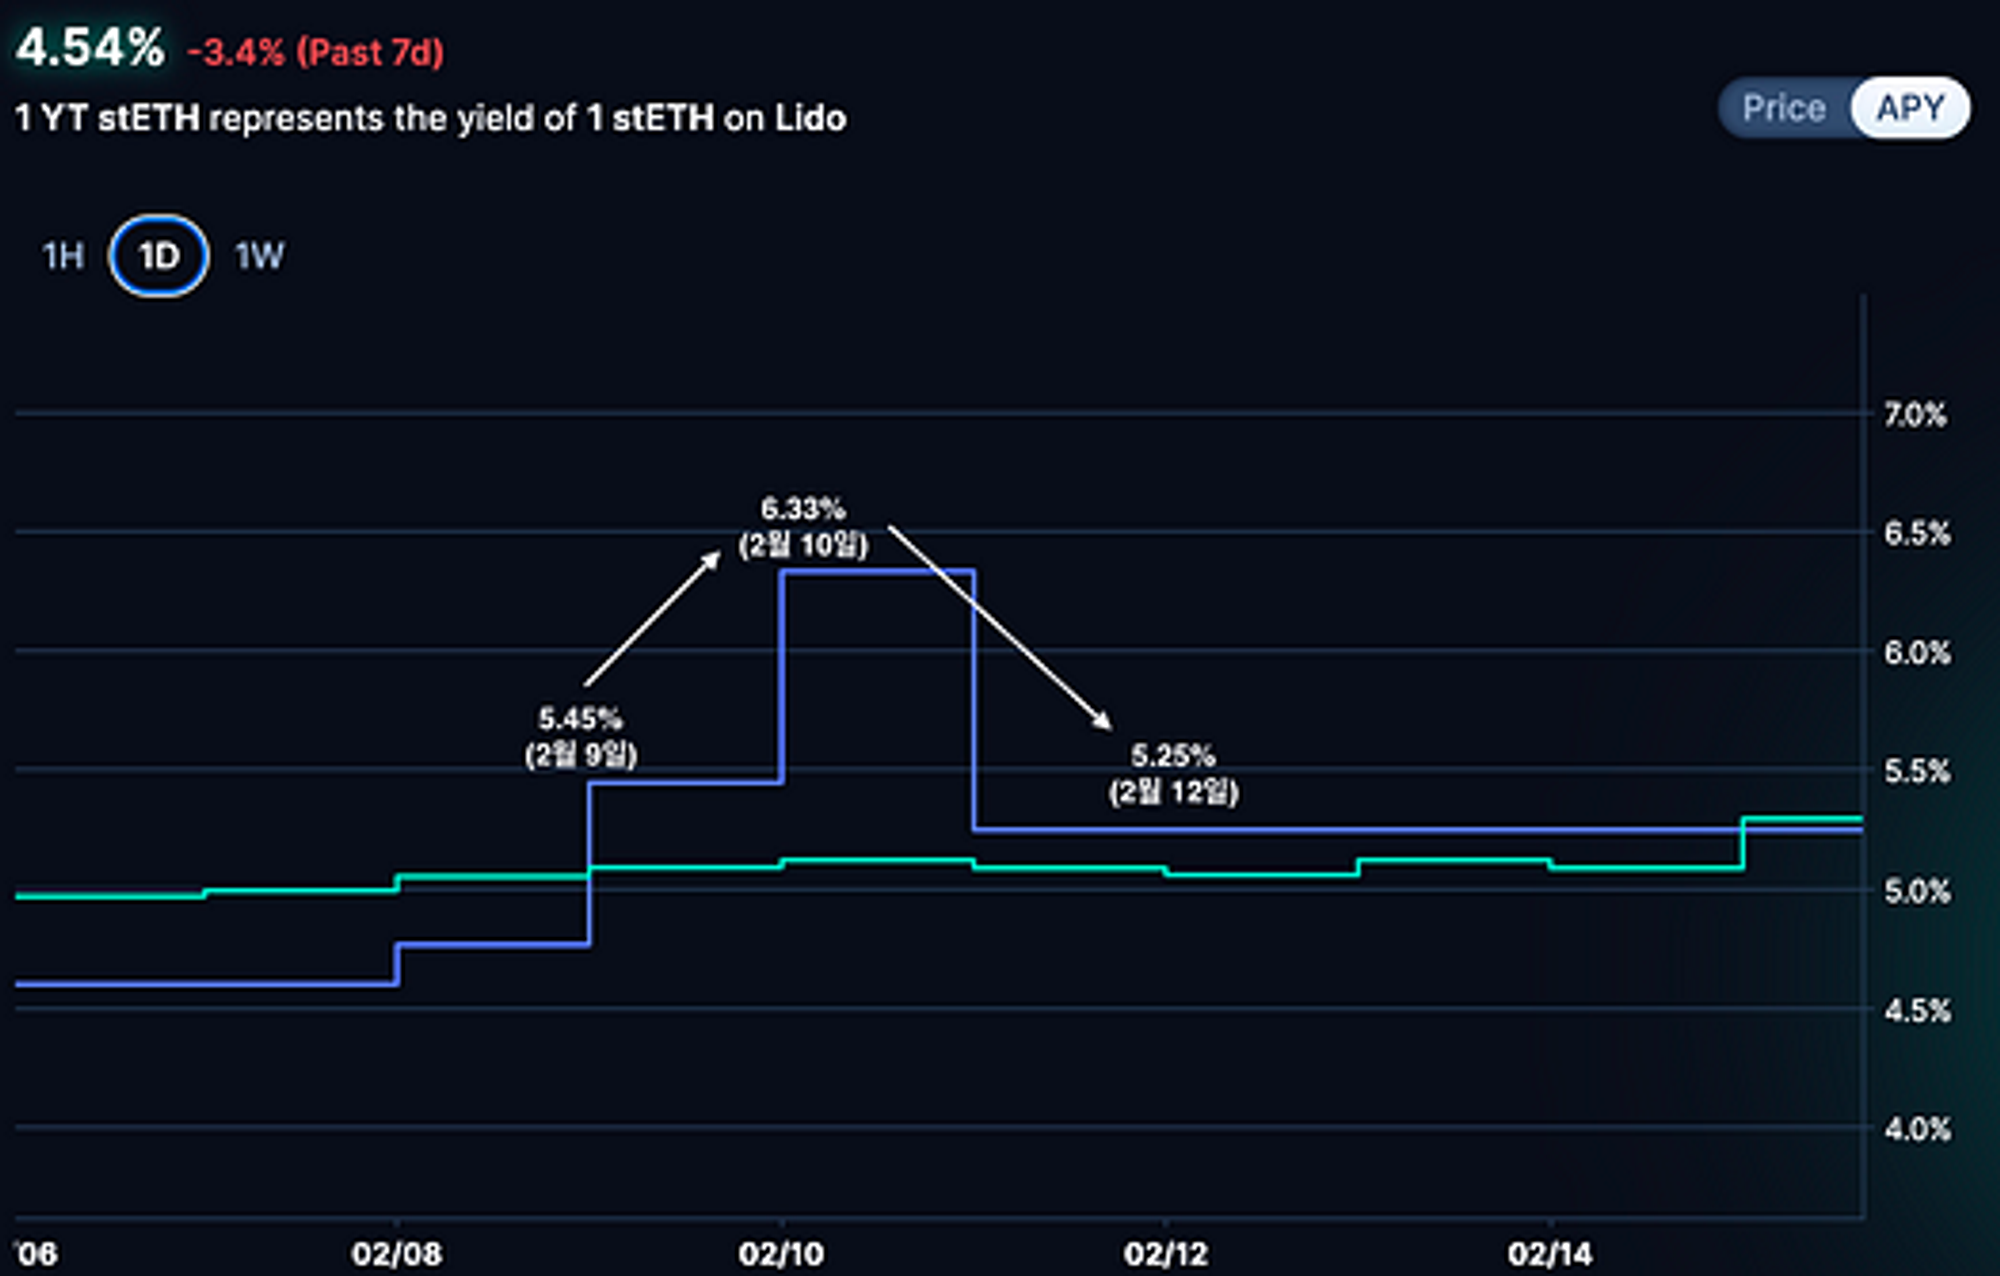
- Green Line: U.APY | Purple Line: I.APY
For example, in the stETH-29JUN2023 market as shown above, an investor who bought YT-stETH on February 9 can sell YT-stETH on February 10 when the I.APY increased, and realize a profit. While an investor who bought PT-stETH on February 10 can sell PT on February 12, when the I.APY decreased, and realize a profit.
4) When U.APY is relatively undervalued
This is the view that the U.APY does not reflect the growth potential of the Dapp properly, which indicates that there is a market consensus that the demand for the Dapp will increase. If one is confident that the U.APY will not rise above the I.APY, one can choose a strategy of buying PT to lock in the current interest rate until the bond matures.
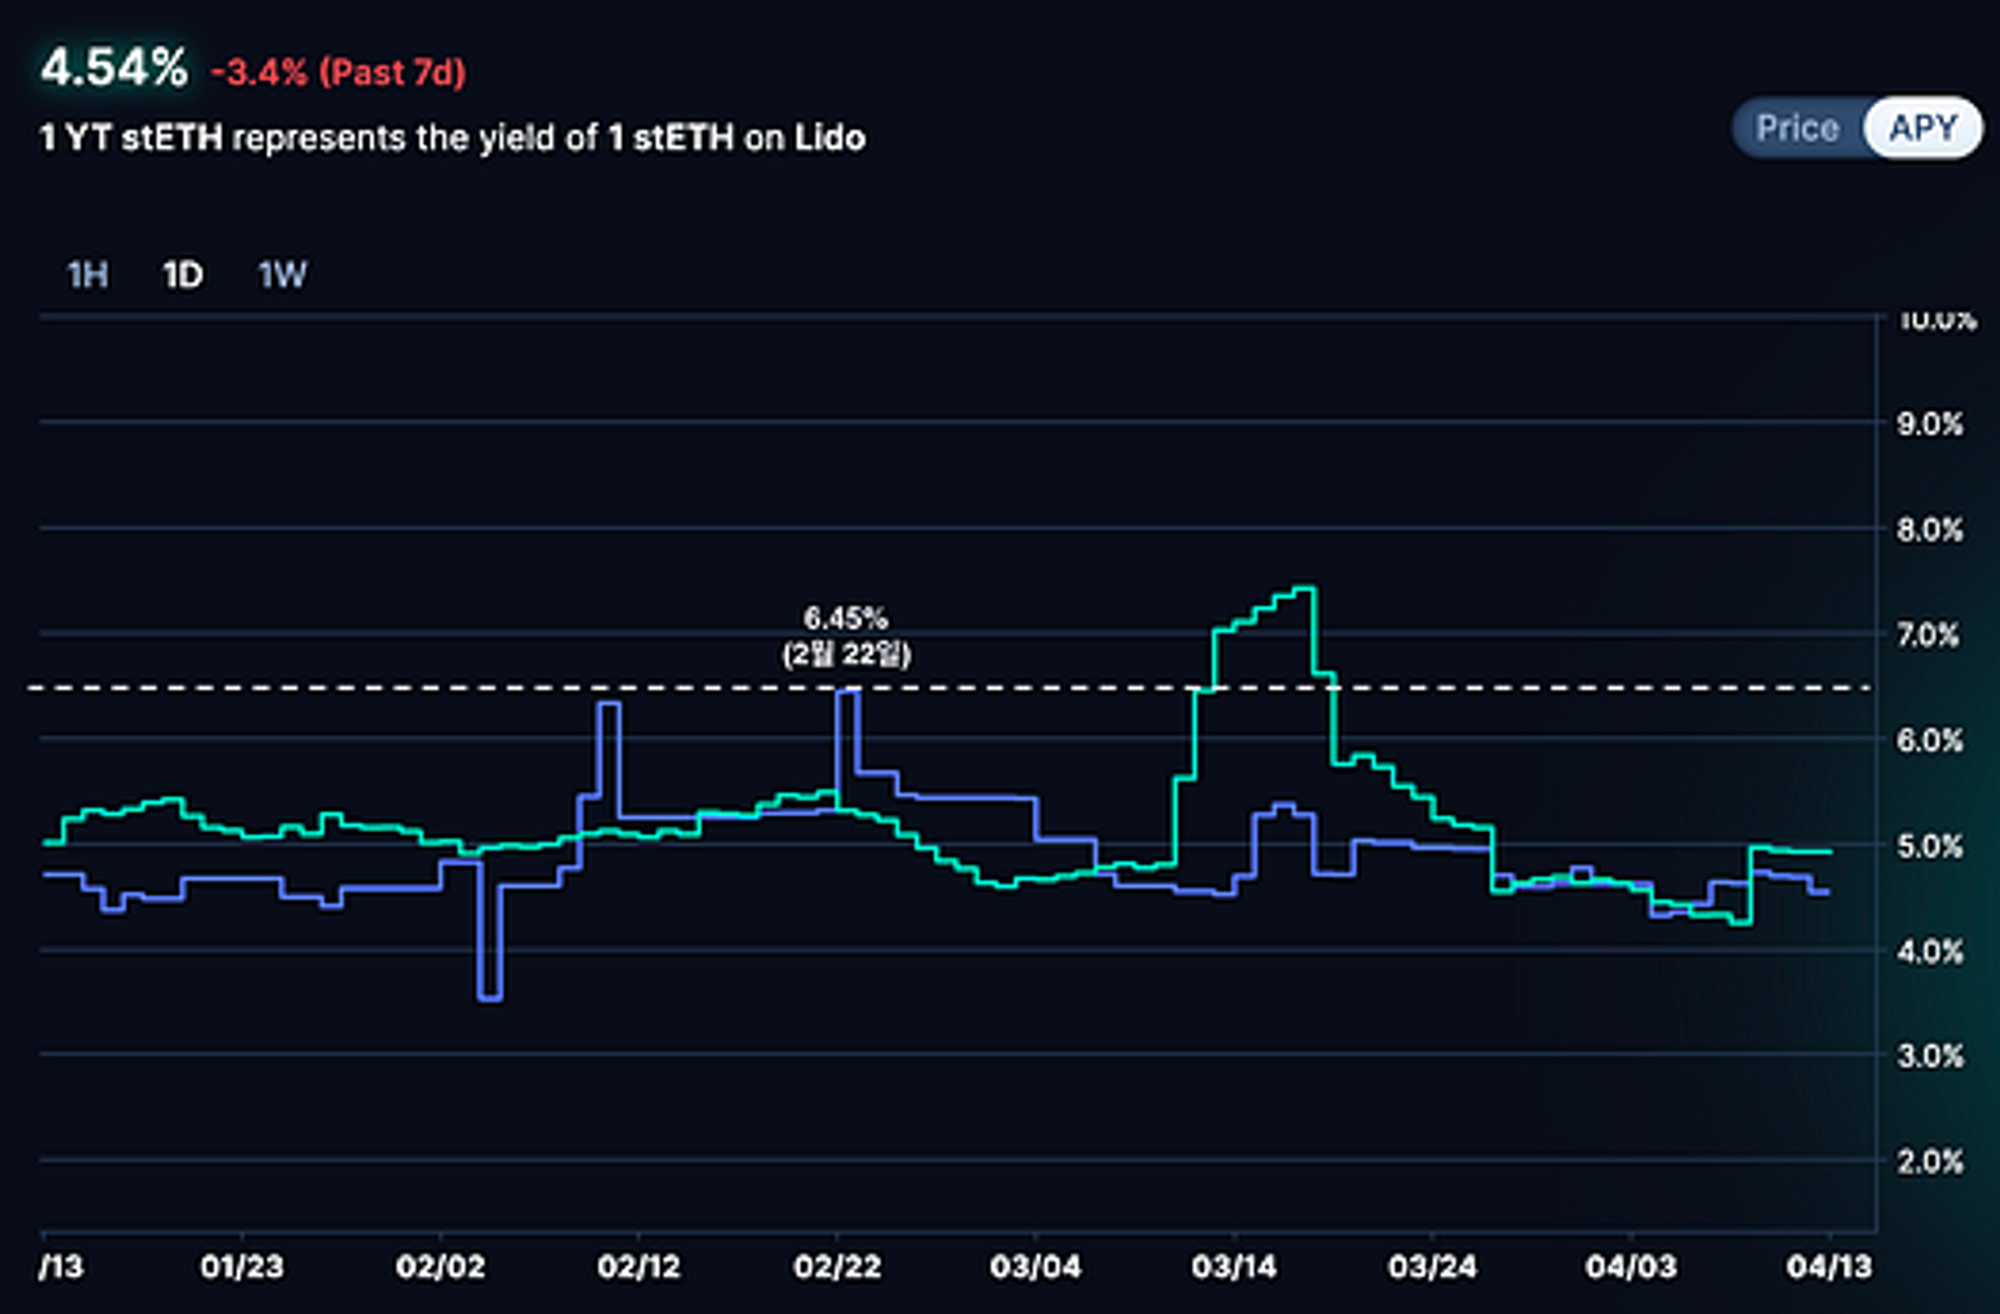
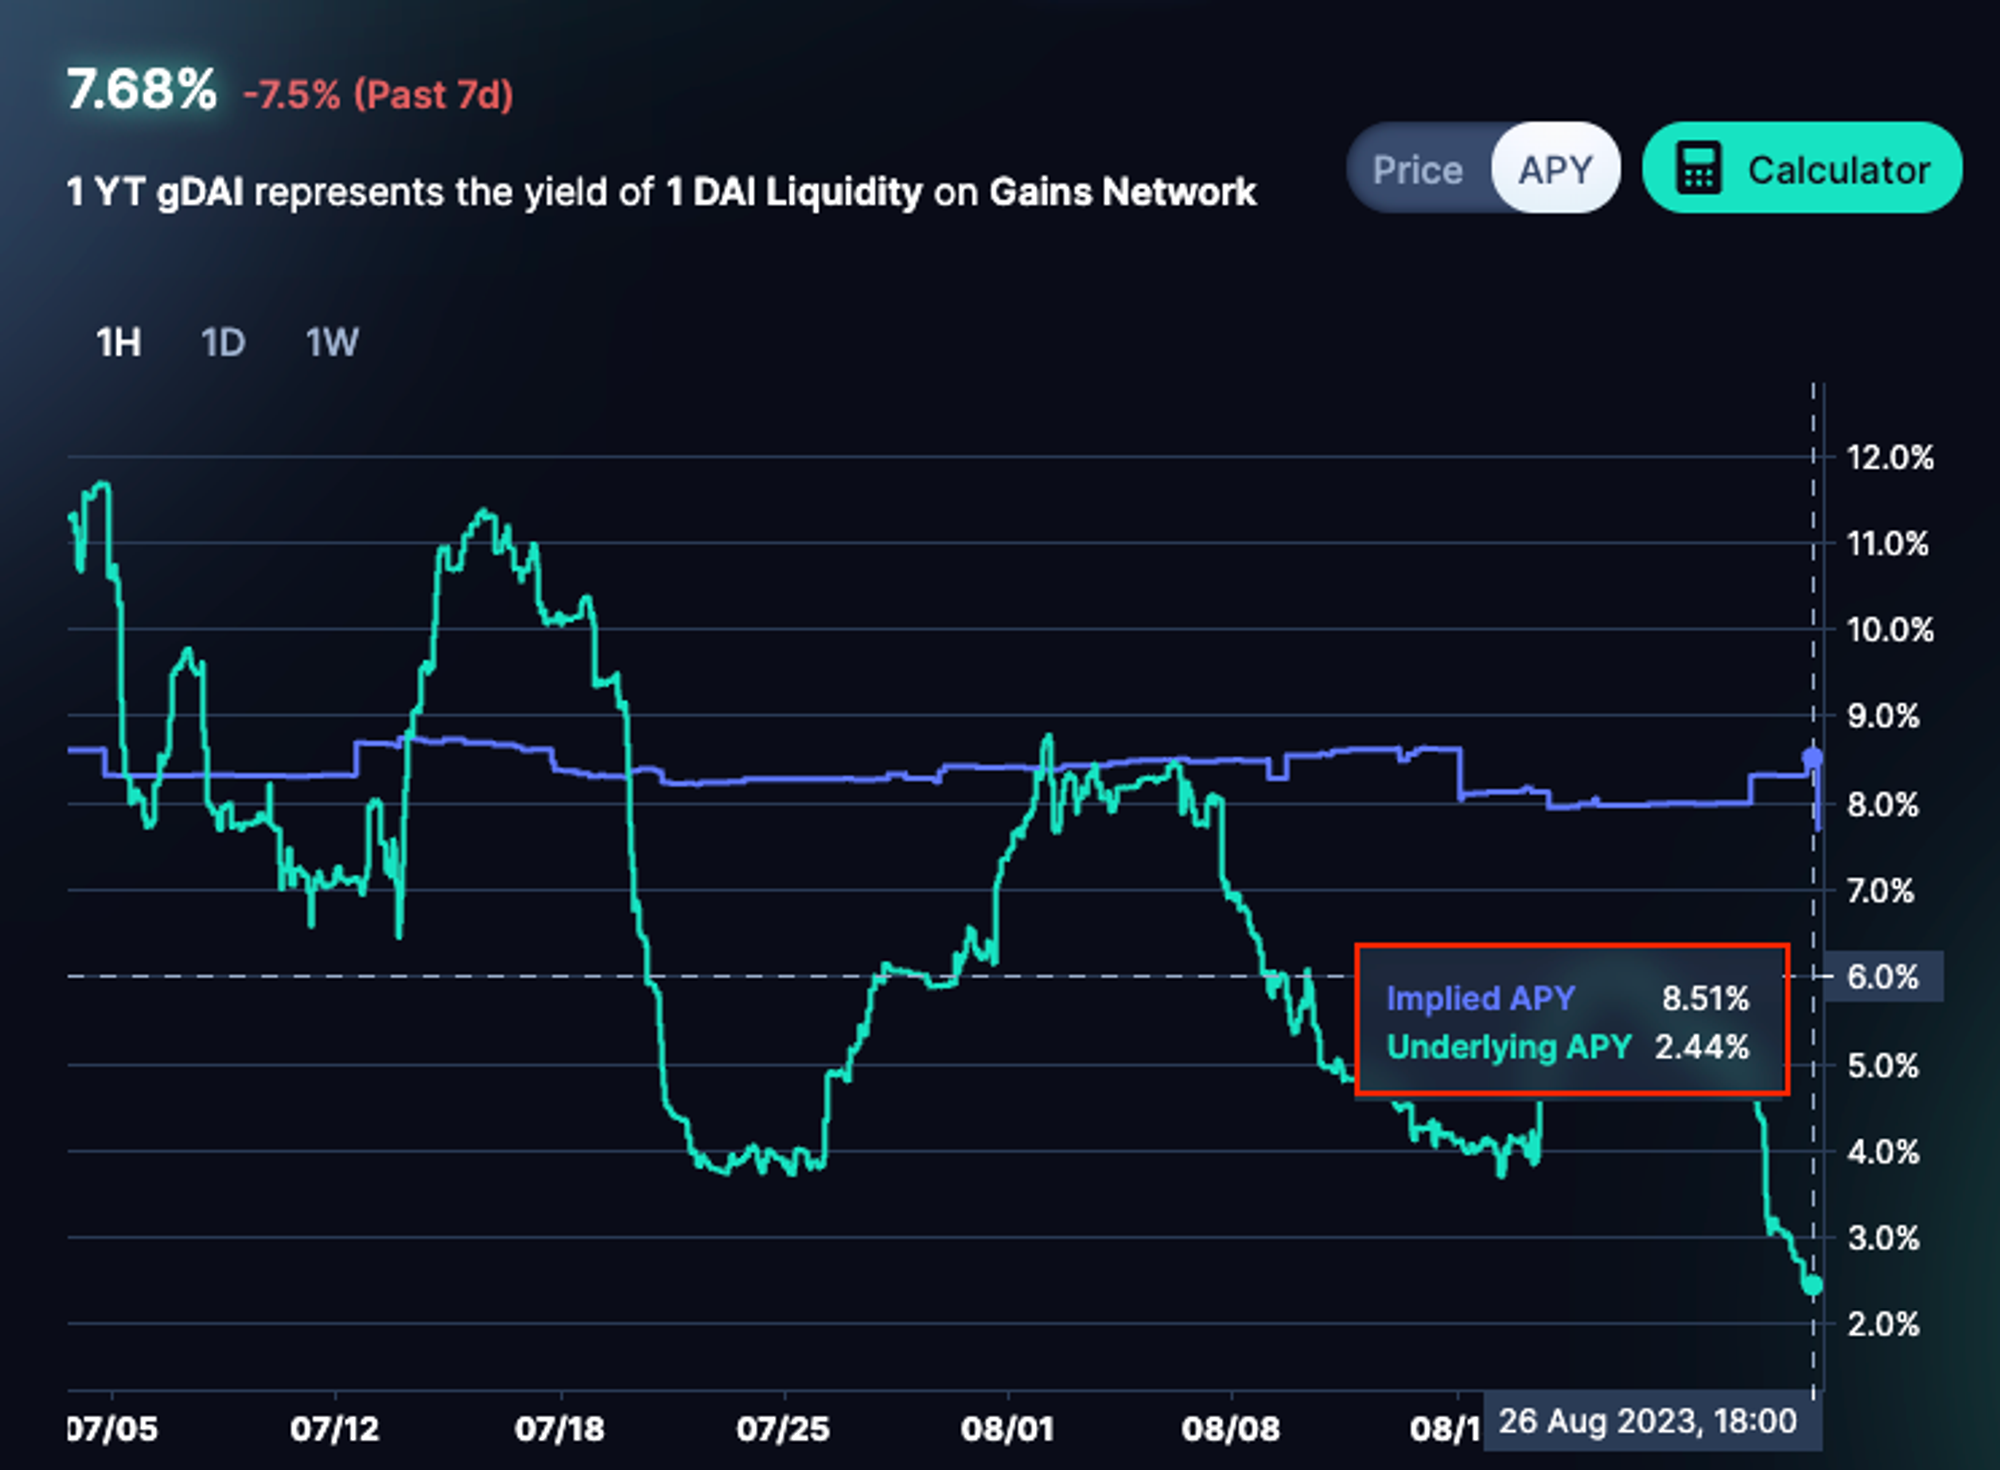
- Green Line: U.APY | Purple Line: I.APY
While there are some cases where U.APYs are higher than 6.45%, it can be shown that, on average, earning a fixed 6.45% interest rate is more profitable than the actual U.APY.
1.5. Pendle Finance AMM
SYT, PT, and YT all follow the ERC20 standard and are stored in investors' wallets, so they can be traded freely regardless of the bond's maturity. In this case, a passive investor would buy PT and hold it to maturity, but a more aggressive investor could arbitrage by continuously buying and selling PT and YT until the bond matures. In the past, Pendle Finance v1 created and managed separate SYT / YT liquidity pools and SYT / OT (formerly PT) liquidity pools to accommodate this swap demand, as shown below.

However, the problem with this structure is that both swap requesters (takers) and liquidity providers (makers) lose money. First of all, the existence of two pools for one bond (SYT/YT, SYT/PT) results in fragmented liquidity, with each pool being more exposed to slippage and price impact, in turn causing swap requesters to lose money by swapping on unfavorable terms. Furthermore, in liquidity pools where the correlation between the two assets is relatively small, such as SYT/YT, the liquidity provider will lose money as impermanent losses occur as the price of the asset changes. Finally, the rewards from LM (Liquidity Mining) and swaps should be split between the two pools, which reduces the amount of rewards taken by liquidity providers.
To address these issues, Pendle Finance v2 eliminates the SYT/YT liquidity pool and adopts a structure where swaps for YT, PT, and SYT are all handled in the SYT/PT liquidity pool. The figure below shows the stETH-26DEC2024 Market in v2, and you can see that the liquidity pool is composed of SY and PT tokens only.
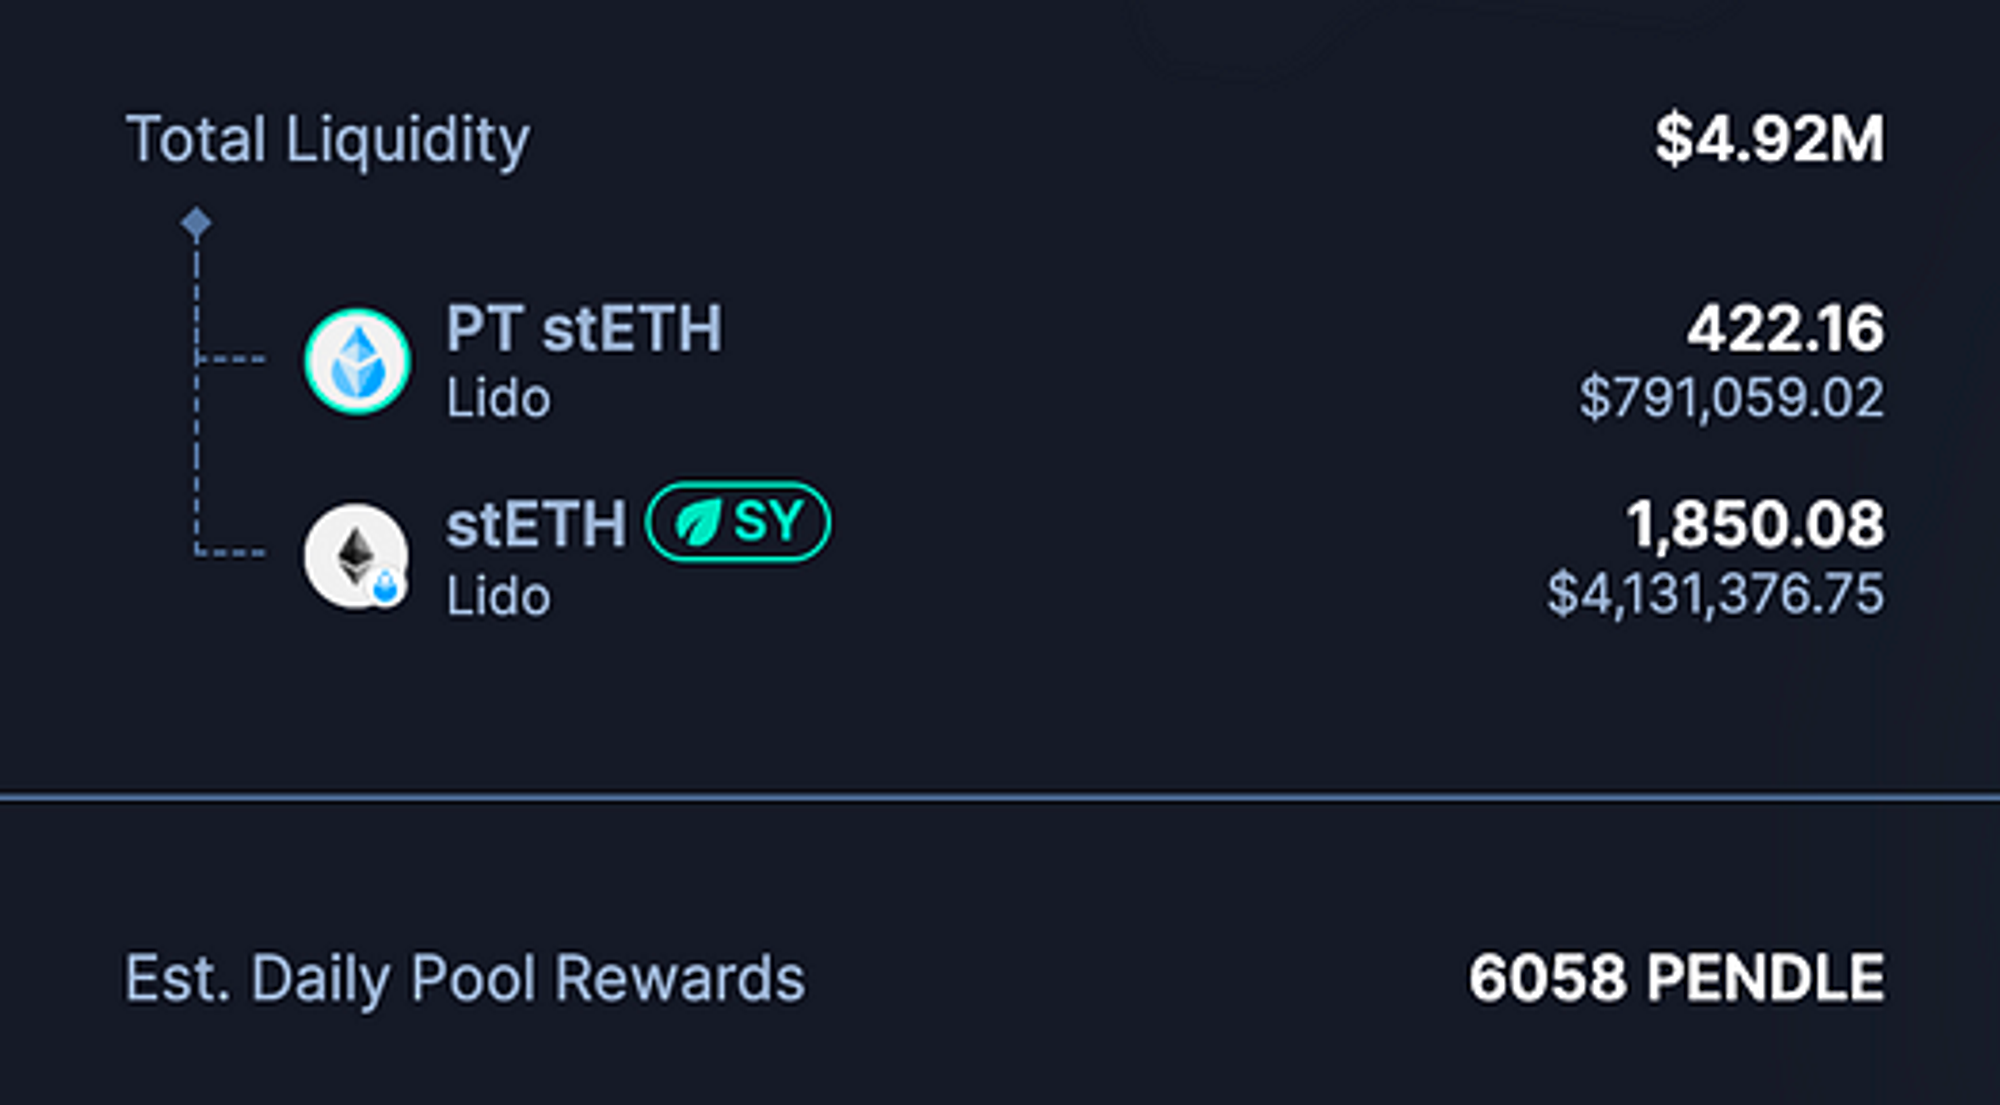
This pool structure allows the protocol to handle both PT and YT swaps within a single liquidity pool, which eliminates liquidity fragmentation and offers swaps at better terms to swap requesters. In addition, since PT is a discounted bond to SYT, the correlation between these two assets is very high, reducing the risk from IL.
**PT cannot vary significantly in price from SYT because its price only fluctuates within the range of the ybtoken's interest rate, and its value will be the same as SYT when it matures. Therefore, liquidity providers are not exposed to IL at all if they do not withdraw liquidity until maturity.
Furthermore, Pendle Finance v2 AMM concentrates liquidity in the areas where PT & YT swaps occur most frequently. This is consistent with Concentrated Liquidity, which funnels liquidity into the most frequently swapped segments, and is an efficient use of capital.
Finally, you may be wondering how a YT swap is possible in the absence of a SYT/YT Pool. By leveraging the relationship between SY & PT & YT, swaps that include YT can be executed using Flash Swap. Let's see how it works with an example.
[Assumption: 1 SY-stETH: $1,000, 1 PT-stETH: $950, 1 YT-stETH: $50]
YT-stETH Mint
- Investor A pays 1 SY-stETH to buy $1,000 worth of YT-stETH ($50). (When it comes to an asset other than SY-stETH, it can be swapped via Kyberswap as the optimal route)
- The swap contract withdraws 19 SY-stETH from the liquidity pool and splits 20 SY-stETH into 20 PT-stETH and 20 YT-stETH.
- Out of this, 20 YT-stETH will be paid to investors and the remaining 20 PT-stETH will be swapped for 19 SY-stETH.
- The 19 SY-stETH borrowed from the liquidity pool in step 2 is returned, concluding the transaction.
- As a result, the price of PT-stETH decreases as more PT-stETH is added to the pool in step 3.
YT-stETH Burn
- Investor A pays 20 YT-stETH to sell $1,000 worth of YT-stETH ($50).
- The swap contract withdraws 20 PT-stETH from the liquidity pool and synthesizes it into 20 SY-stETH.
- Out of this, 1 SY-stETH will be paid to the investor and the remaining 19 SY -stETH will be swapped for 20 PT-stETH.
- The 20 PT-stETH borrowed from the liquidity pool in step 2 is returned, concluding the transaction.
- As a result, the price of PT-stETH increases as additional PT-stETH is withdrawn from the pool in step 3.
2. Pendle Finance Tokenomics Structure and Growth Potential
2.1. Pendle Finance Tokenomics
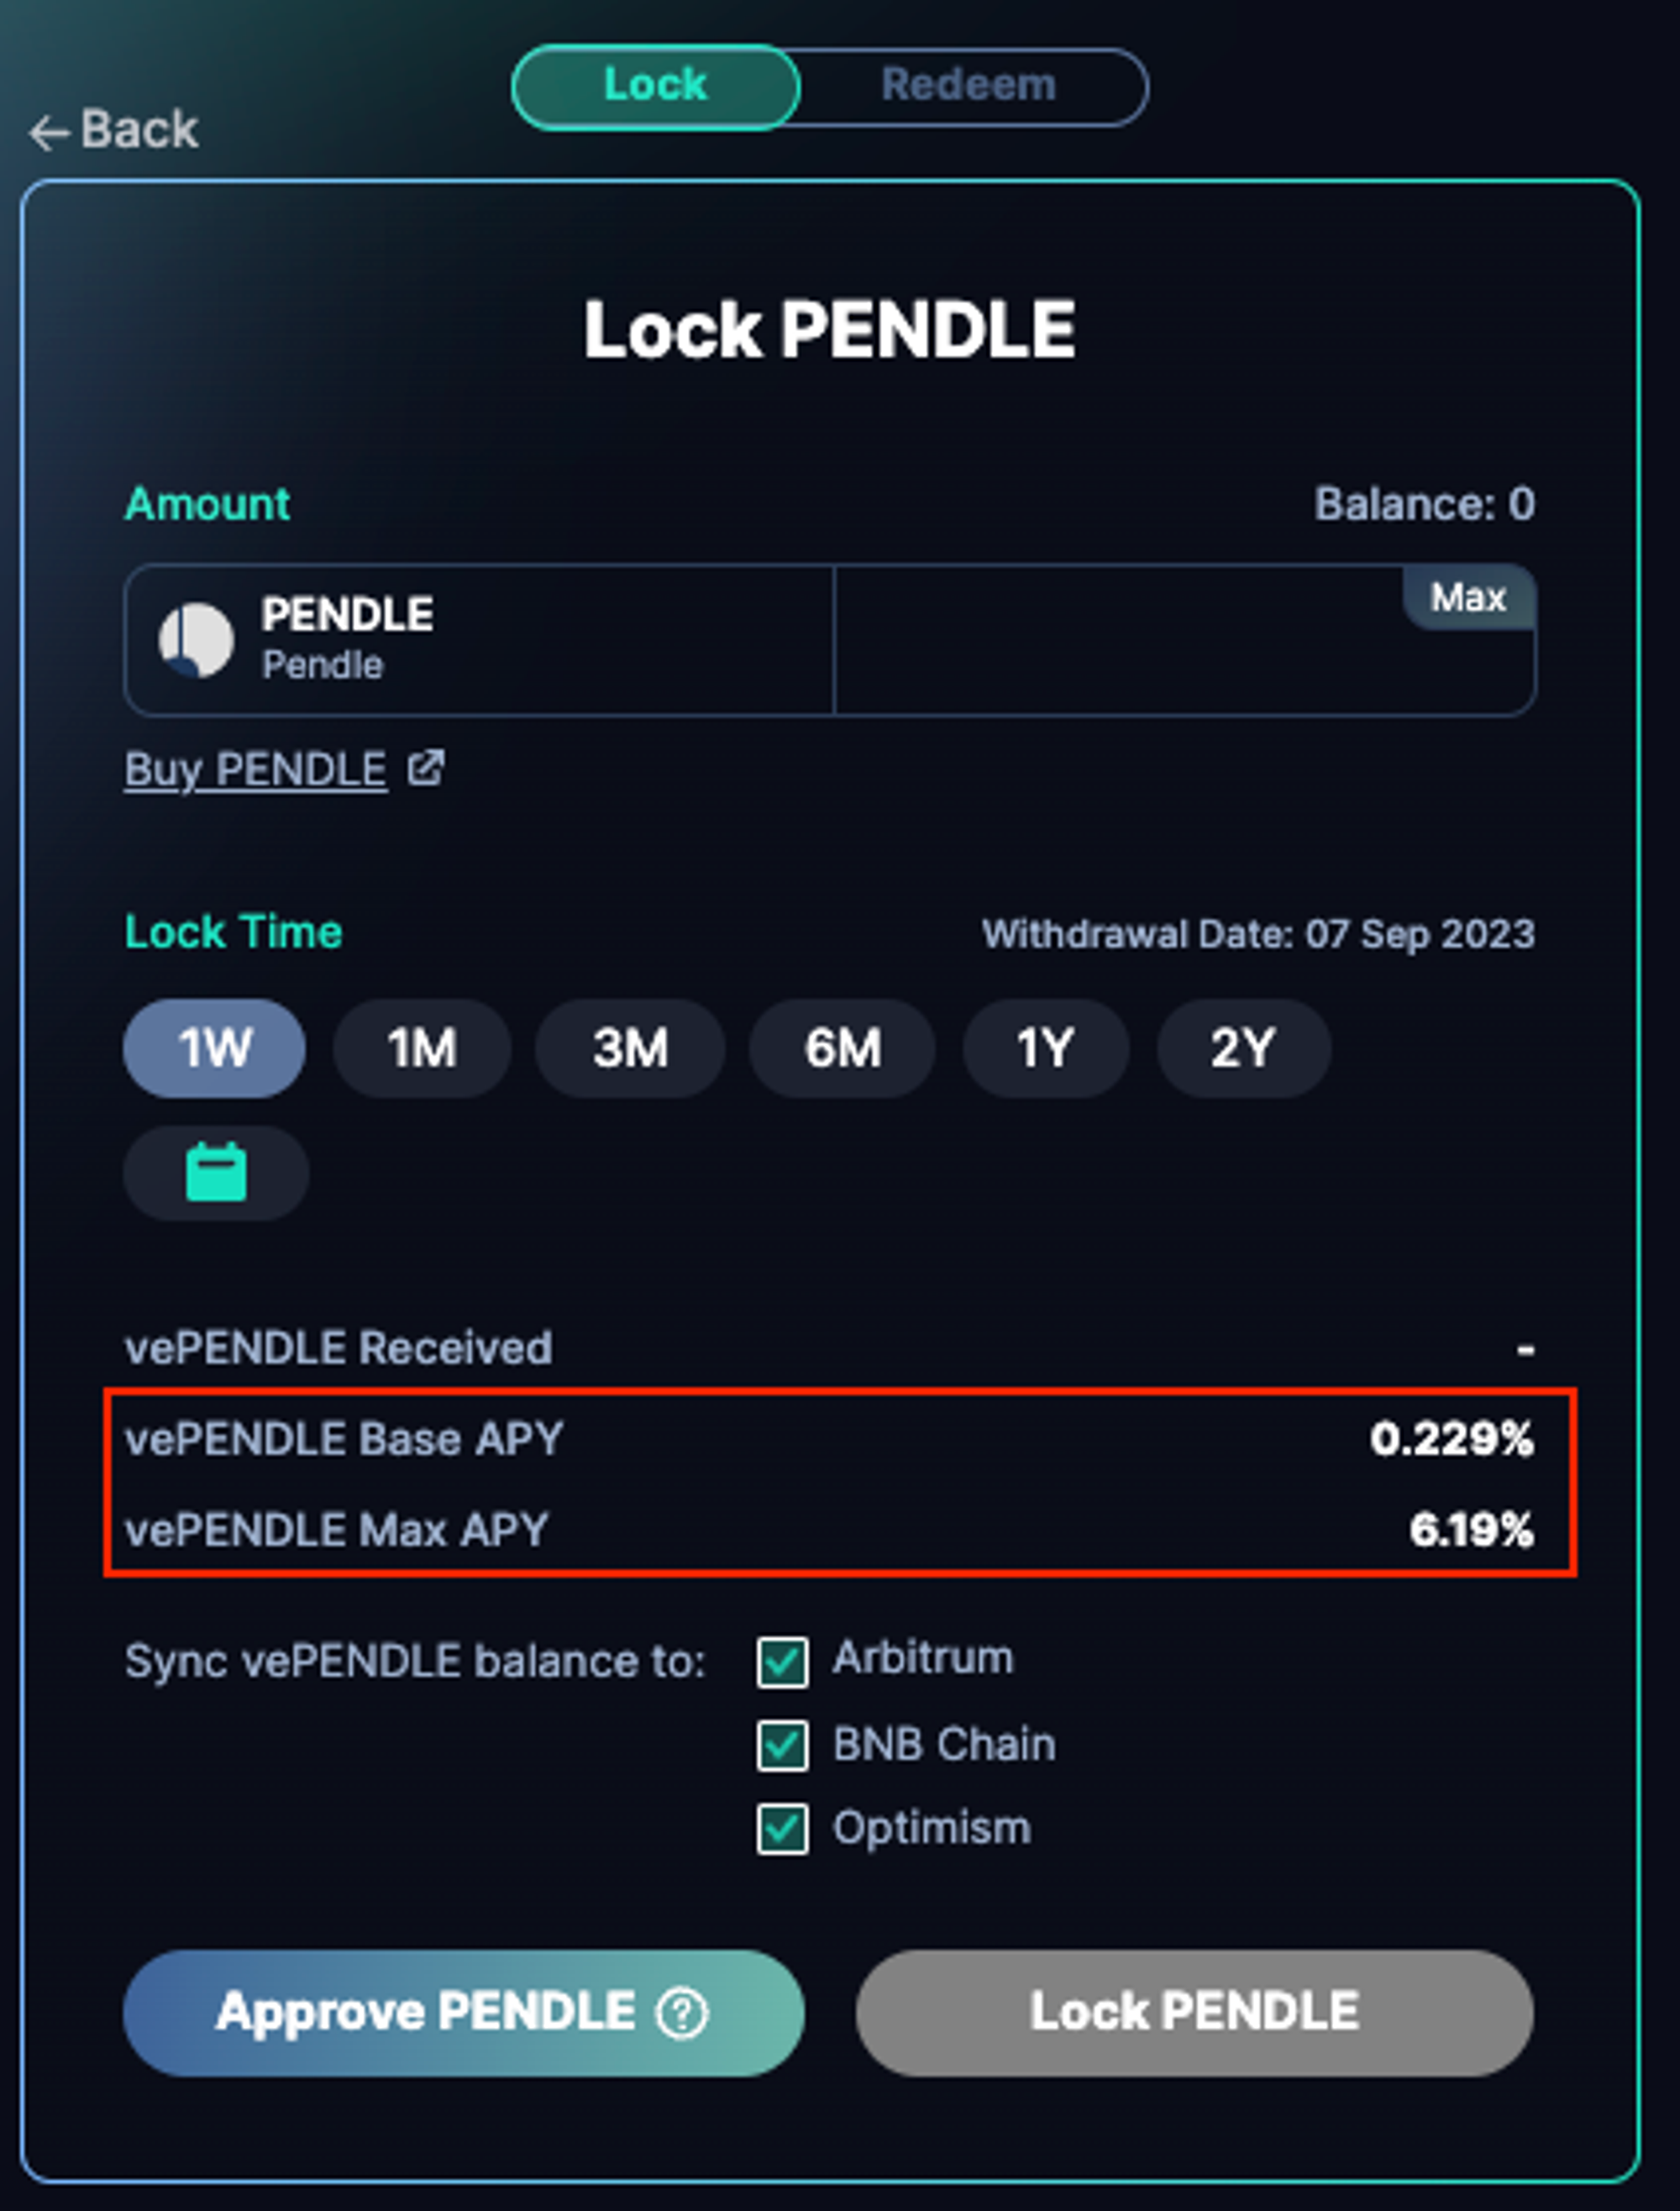
Pendle Finance adopts Curve's vote-escrow (ve) model as its framework and incorporates features from DEXs that recently modified and utilized the vote-escrow approach. $vePENDLE can be earned proportional to the length of time $PENDLE is locked up. The lockup periods range from a minimum of one week to a maximum of two years. At this time, locked $PENDLE cannot be liquidated until the lock-up period ends, but $vePENDLE holders are given the following incentives.
- Full payment of protocol fees (protocol fee: 3% of interest generated by YT) - vePENDLE Base APY
- 80% of transaction fees generated by pools voting with $vePENDLE - vePENDLE Voter APY
- Up to 2.5x Farming Boost if providing liquidity to a liquidity pool
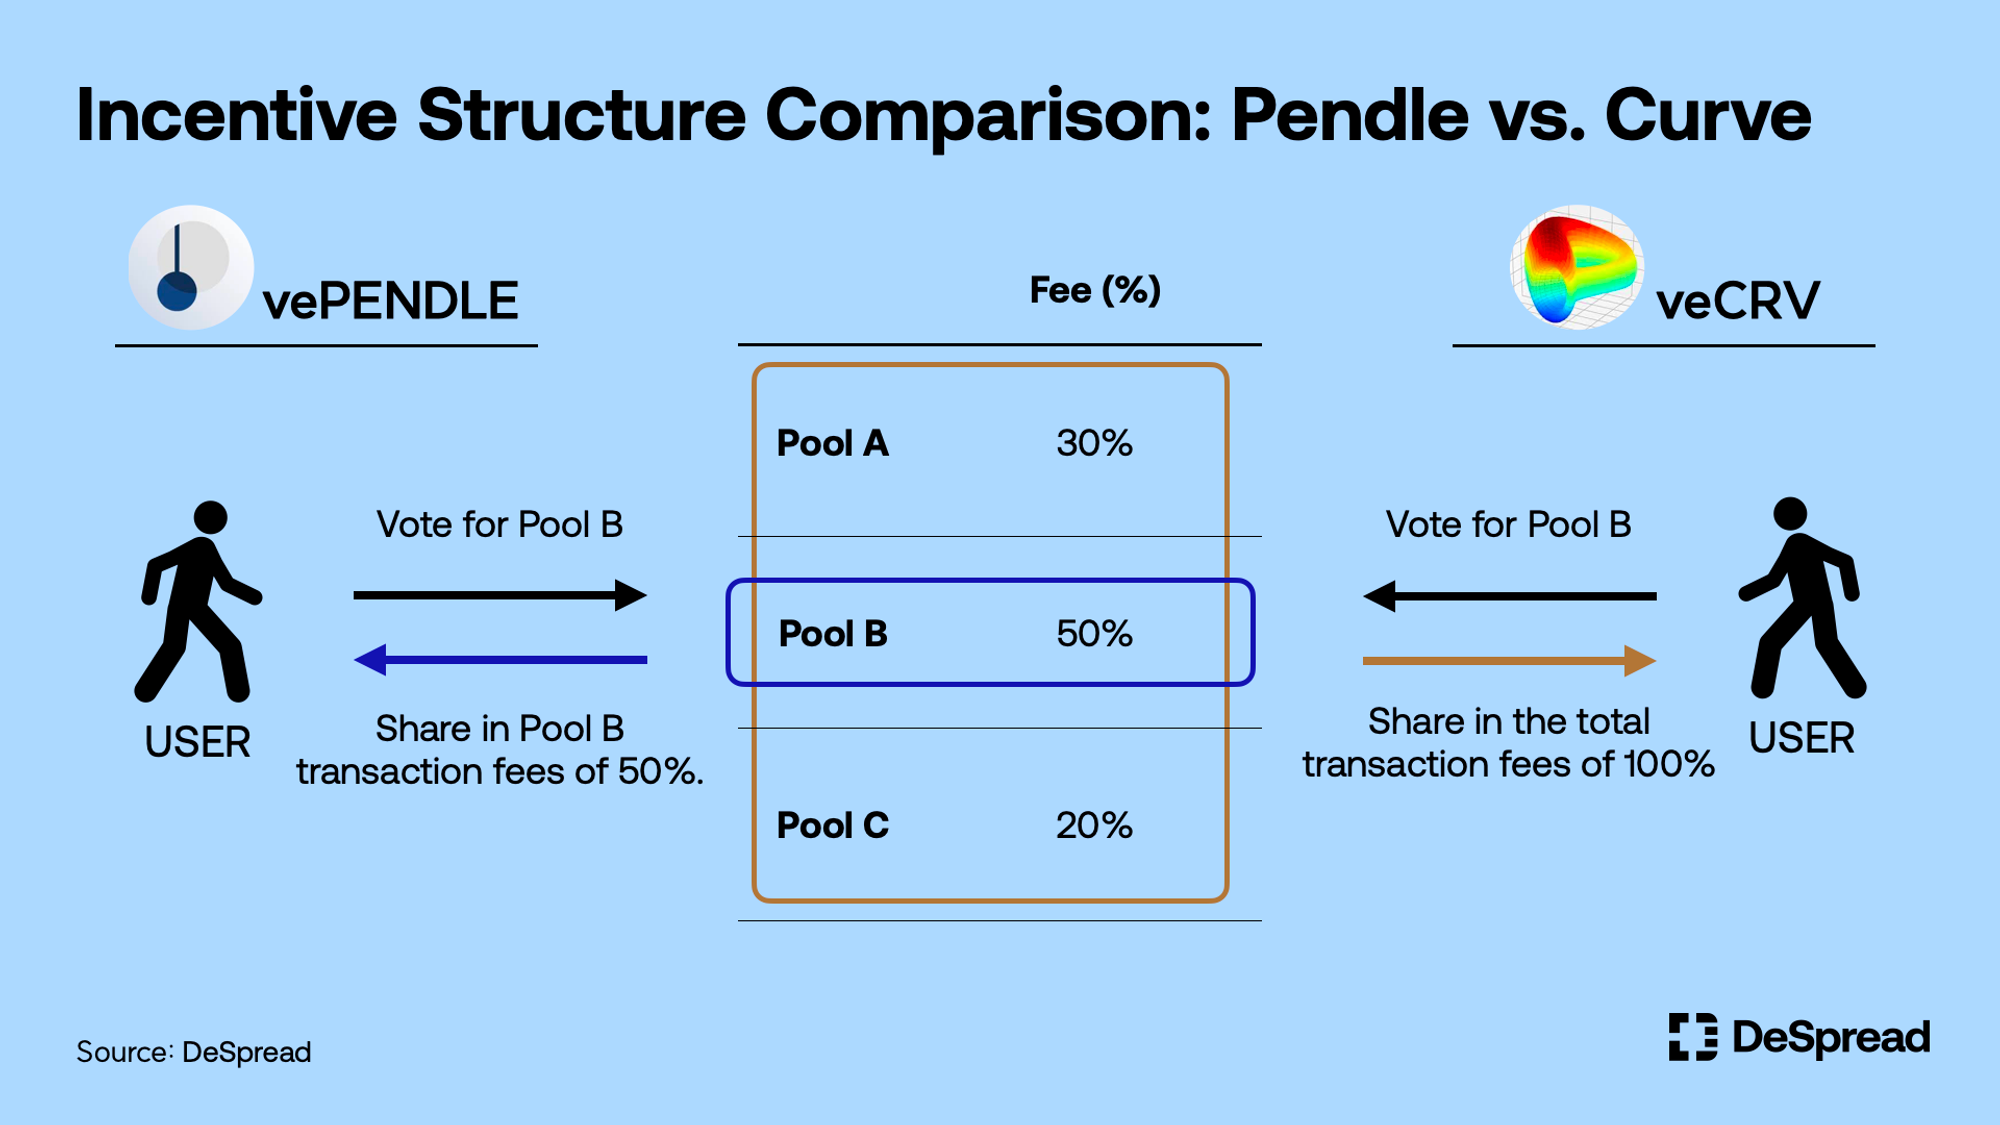
In a traditional veModel (e.g., veCRV), it doesn't matter which pool you vote for because investors who lock up governance tokens receive a portion of the transaction fees generated by all pools. The problem is that the incentive structure of investors who lock up governance tokens is not aligned with the interests of the gauge voting function. This misalignment can potentially result in liquidity migrating to other DEXs without sufficient CRV rewards flowing into liquidity pools that generate significant transaction fees.
However, recently launched veModel DEXs have changed their structure to only pay transaction fees generated by pools voted by investors who have locked up governance tokens. This aligns gauge voting with the incentives of investors who have locked up governance tokens, and Pendle Finance is adopting the same structure. This change ensures that incentives are distributed based on transaction fee generation, favoring liquidity pools that offer the most value to the protocol.
While the incentive alignment has undergone restructuring, challenges persist. One limitation is that by committing to a long-term lockup of a volatile asset, investors become vulnerable to its price fluctuations throughout the lock-up duration. Additionally, the capital needed to qualify for the Farming Boost is substantial. In particular, to qualify for the Farming Boost, you must be providing liquidity to Pendle Finance and locking up $PENDLE at the same time. To qualify for the Maximum Boost (2.5x), the dollar value of LPs and the amount of $vePENDLE held are considered together, and the lower the dollar value of LPs and the lower the Gauge, the more the Maximum Boost can be achieved with a smaller amount of $vePENDLE. However, for popular pools, the dollar value of LPs is typically higher and the Gauge is also higher, so the capital cost to achieve the Maximum Boost is greater.
Governance aggregators, such as Convex for Curve and Aura for Balancer, address these issues. They provide Liquid Staking Tokens (LSTs) for locked-up governance tokens, allowing investors to exit locked-up positions at their convenience, and provide custodial services to LPs based on the governance tokens they collect, while earning rewards with Maximum Boost.

As with Curve and Balancer, Pendle Finance also has governance aggregators, and there is an ongoing race for $PENDLE. Currently, two platforms, Penpie and Equilibria, are competing for the top spot, with the two Dapps capturing more than half of all $vePENDLE.
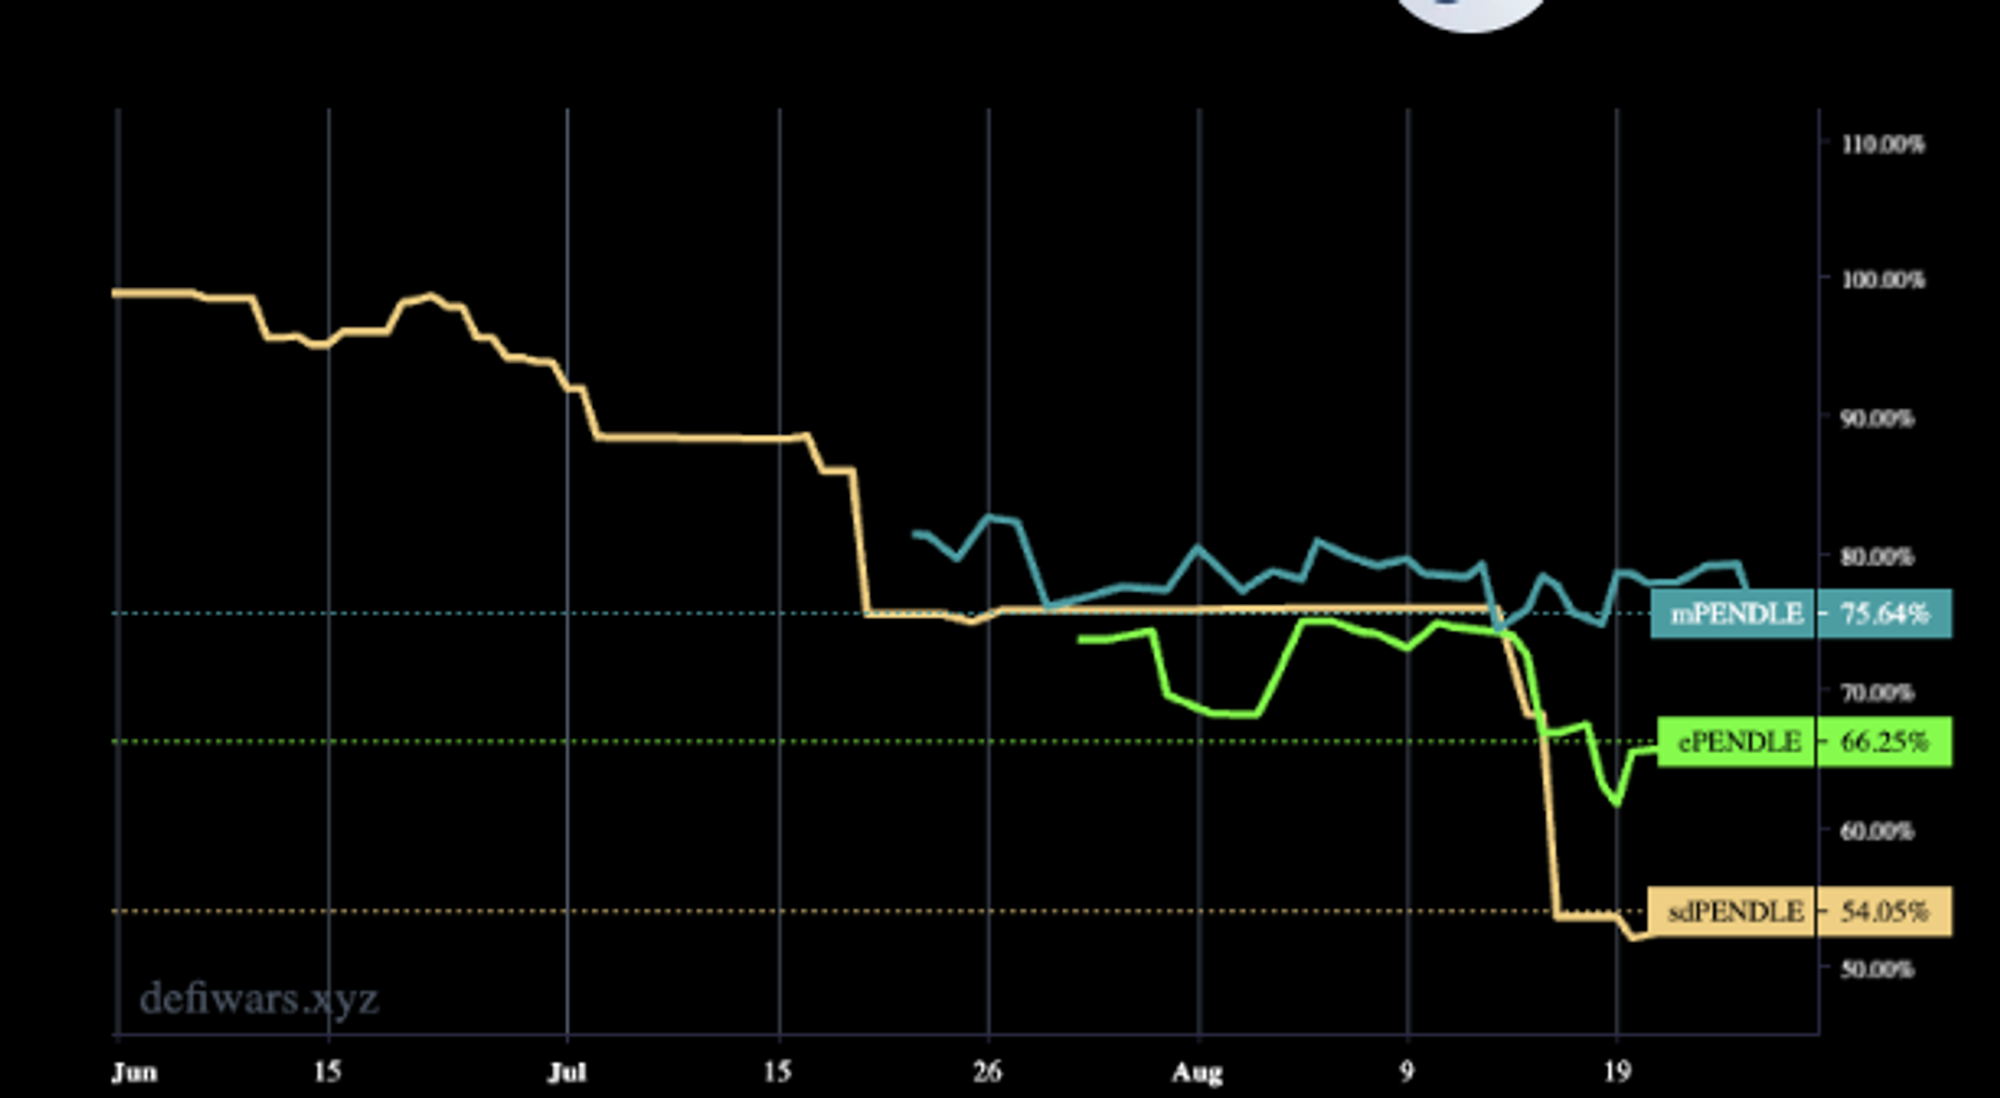
However, it is important to understand that the LSTs offered by governance aggregators do not always match the price of the underlying asset. Rather, it is more accurate to say that there is no reason at all for the LST to be priced in line with the underlying asset, and in most cases, the LST is valued at a discount in the market. Especially during times when the foundational asset's price drops, the LST's peg is more susceptible to breaking due to heightened demand from investors eager to exchange their LSTs for the underlying asset. Currently, both Equilibria and Penpie's LST ($ePENDLE, $mPENDLE) are valued at a discount of over 20%, and while both projects are making various attempts to achieve a 1:1 peg with $PENDLE, much will depend on how the price of $PENDLE moves.
2.2. Growth Potential
Since Pendle securitizes ybtokens and gives them a maturity date of more than one year, it is not possible to attract investor demand if the Dapp's product quality is low or if the underlying asset of the ybtoken is poor. Therefore, the service is limited to Dapps based on network-based blue-chip assets such as $ETH and $BTC or stablecoins that can actually generate meaningful interest. The cases that fit the above criteria are LSD and RWA.
[ LSD ]
Since the beginning of this year, spot exchanges have continued to reduce the size of their ETH staking offerings, as the SEC continues to crack down on staking services offered by those exchanges as having the characteristics of securities. In fact, when it comes to comparing the share of ETH staking from the beginning of the year to now, as shown in the figure below, we can see that spot exchanges have significantly reduced their share and that LSDs (e.g. $stETH, $rETH, $sfrxETH) are benefiting from this.
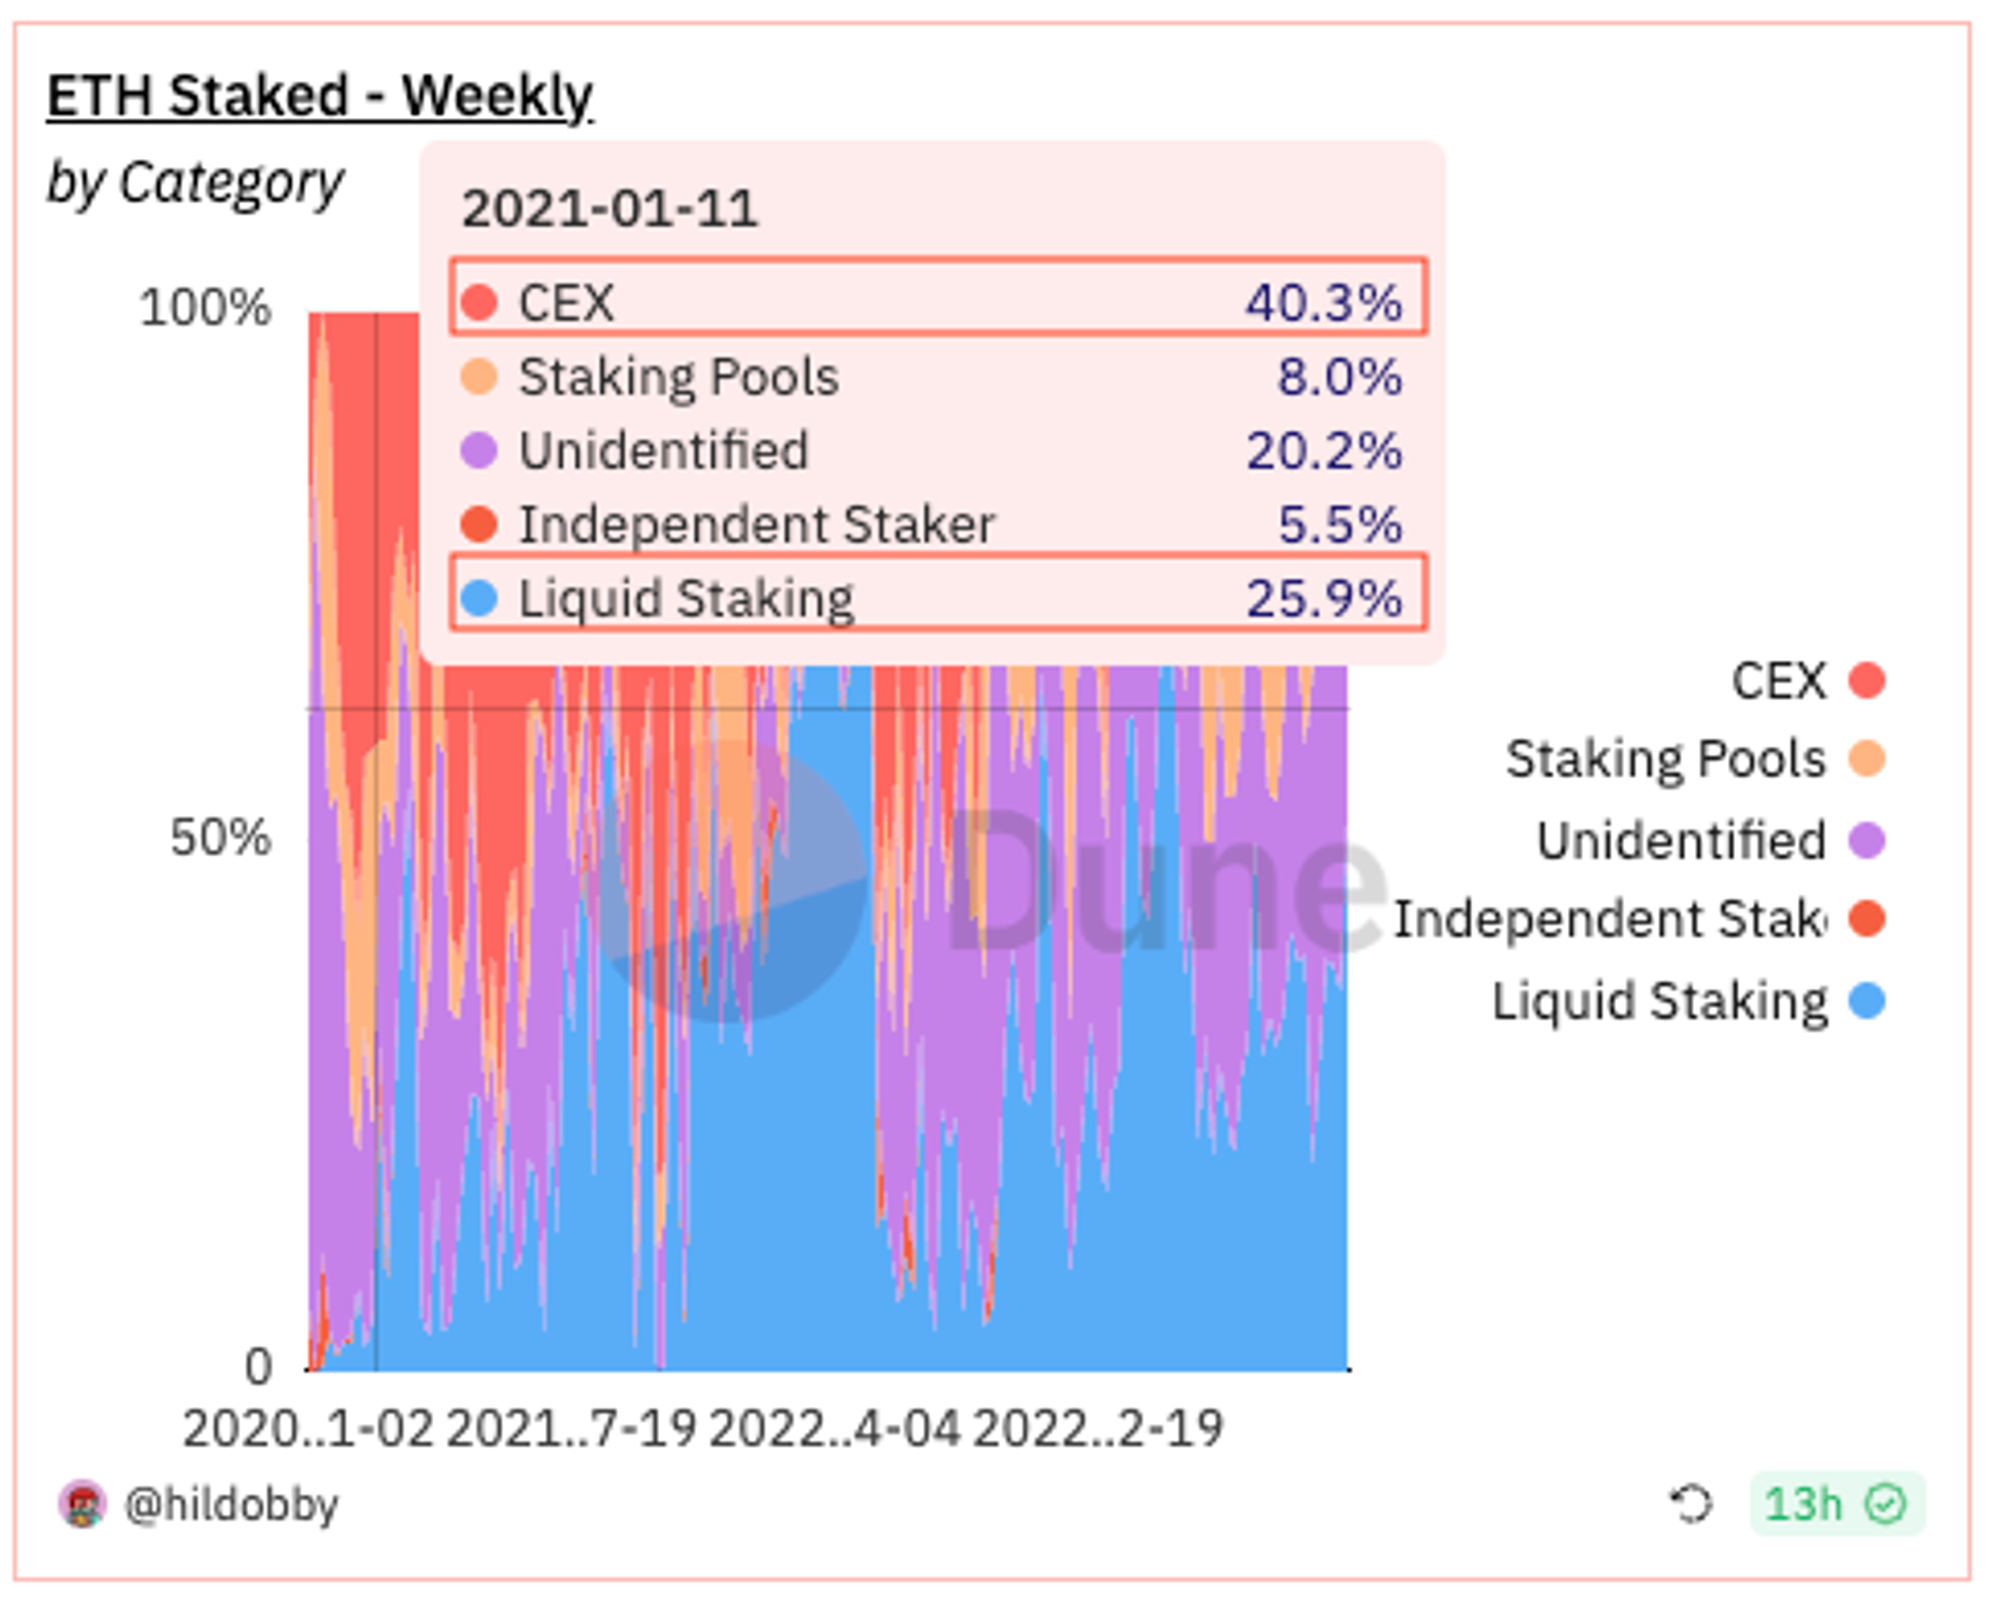
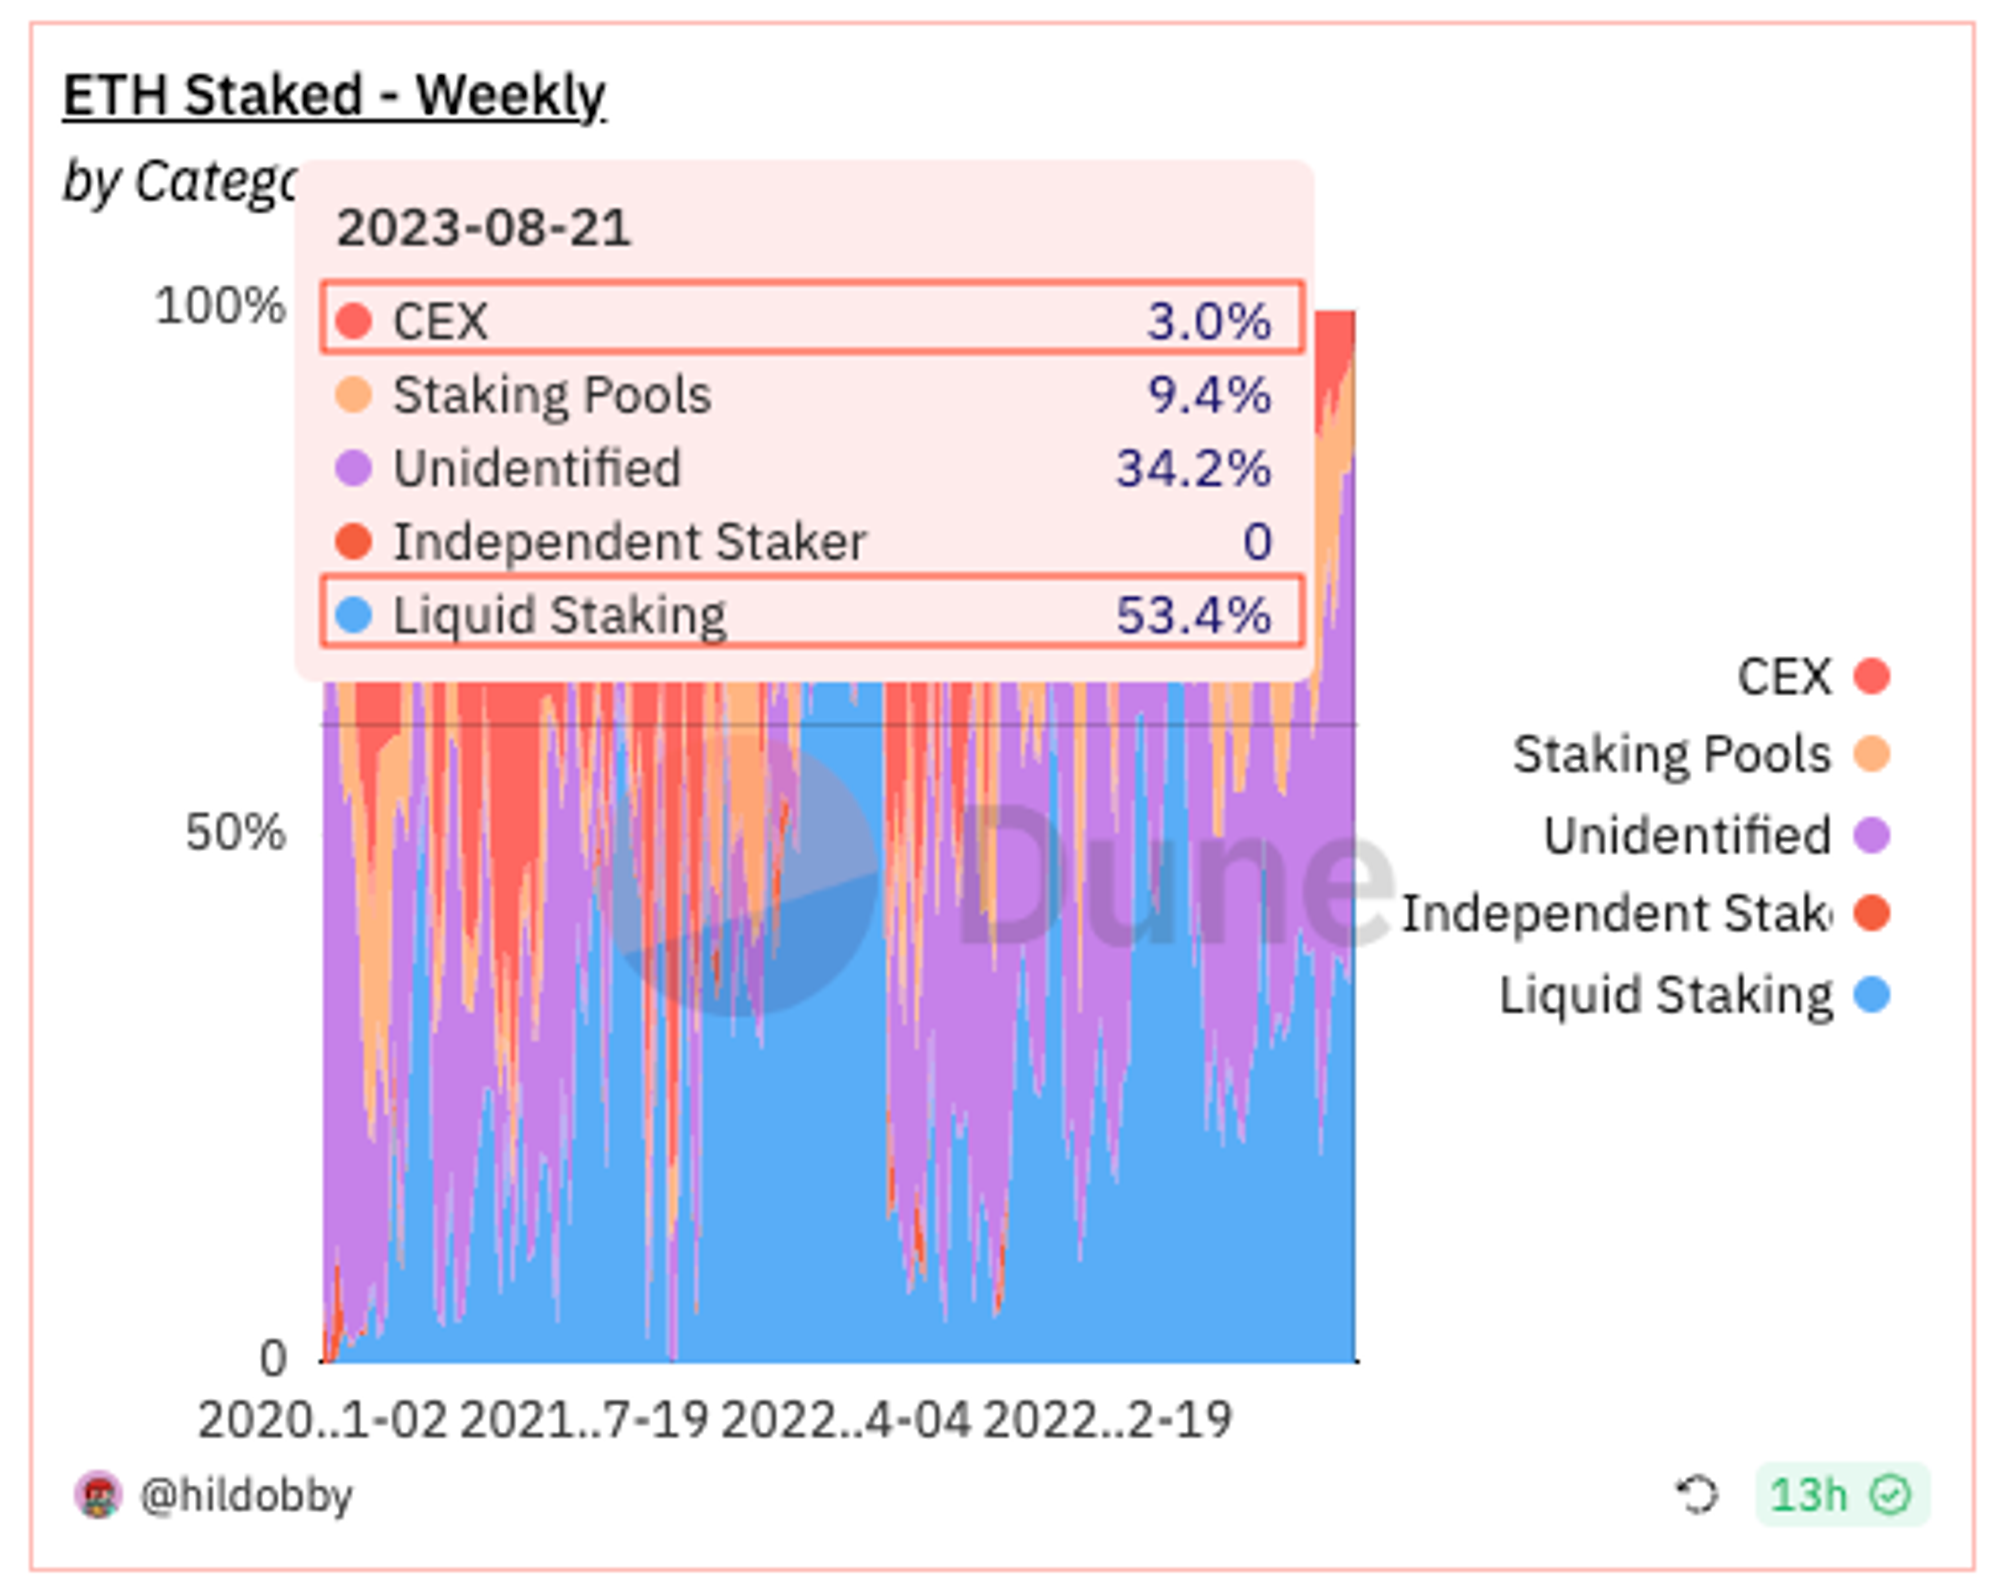
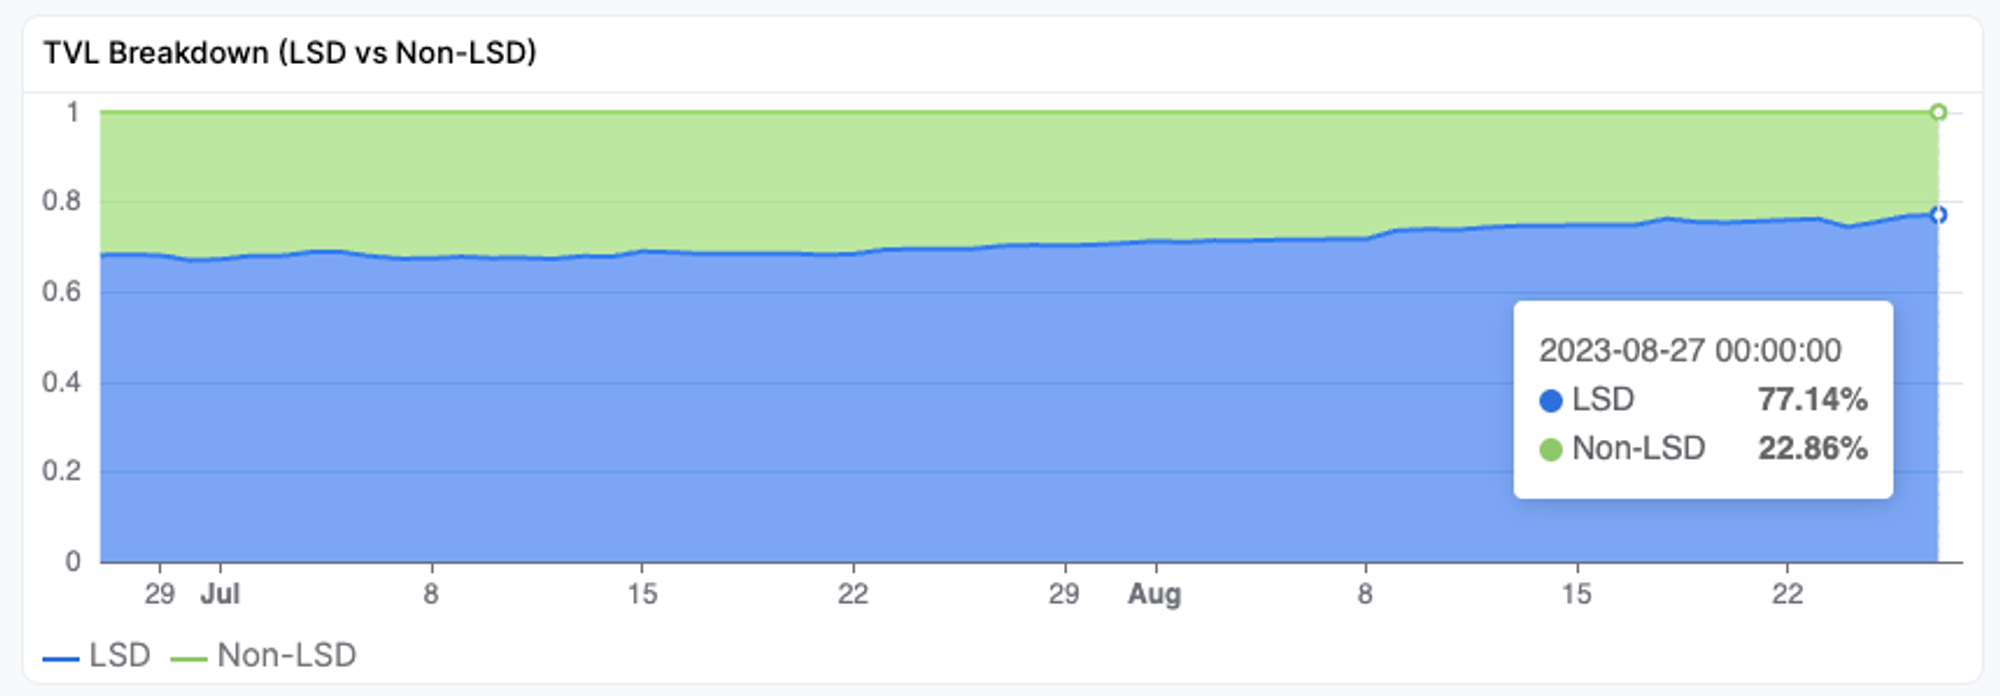
Given that LSD currently accounts for nearly 77% of Pendle Finance's TVL, it is reasonable to expect that if this trend continues and the LSD sector keeps growing, it will also have a positive impact on Pendle Finance's performance.
Moreover, given the very small size of the ybtoken being utilized on Pendle compared to the TVL of LSDs (e.g. Lido, frxETH), it can be expected that Pendle Finance's TVL still has plenty of room to grow.
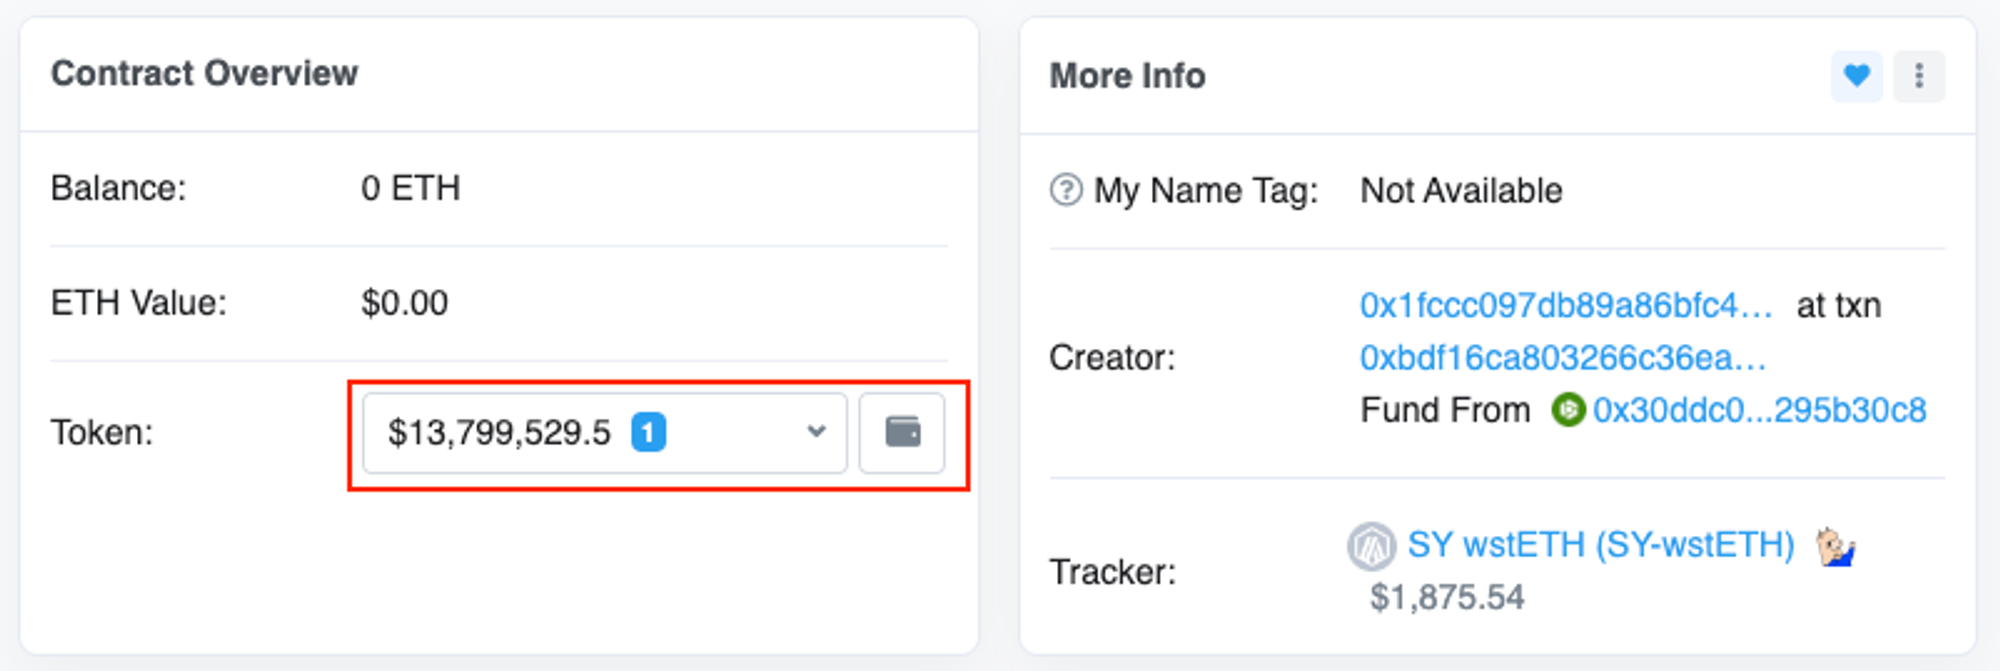
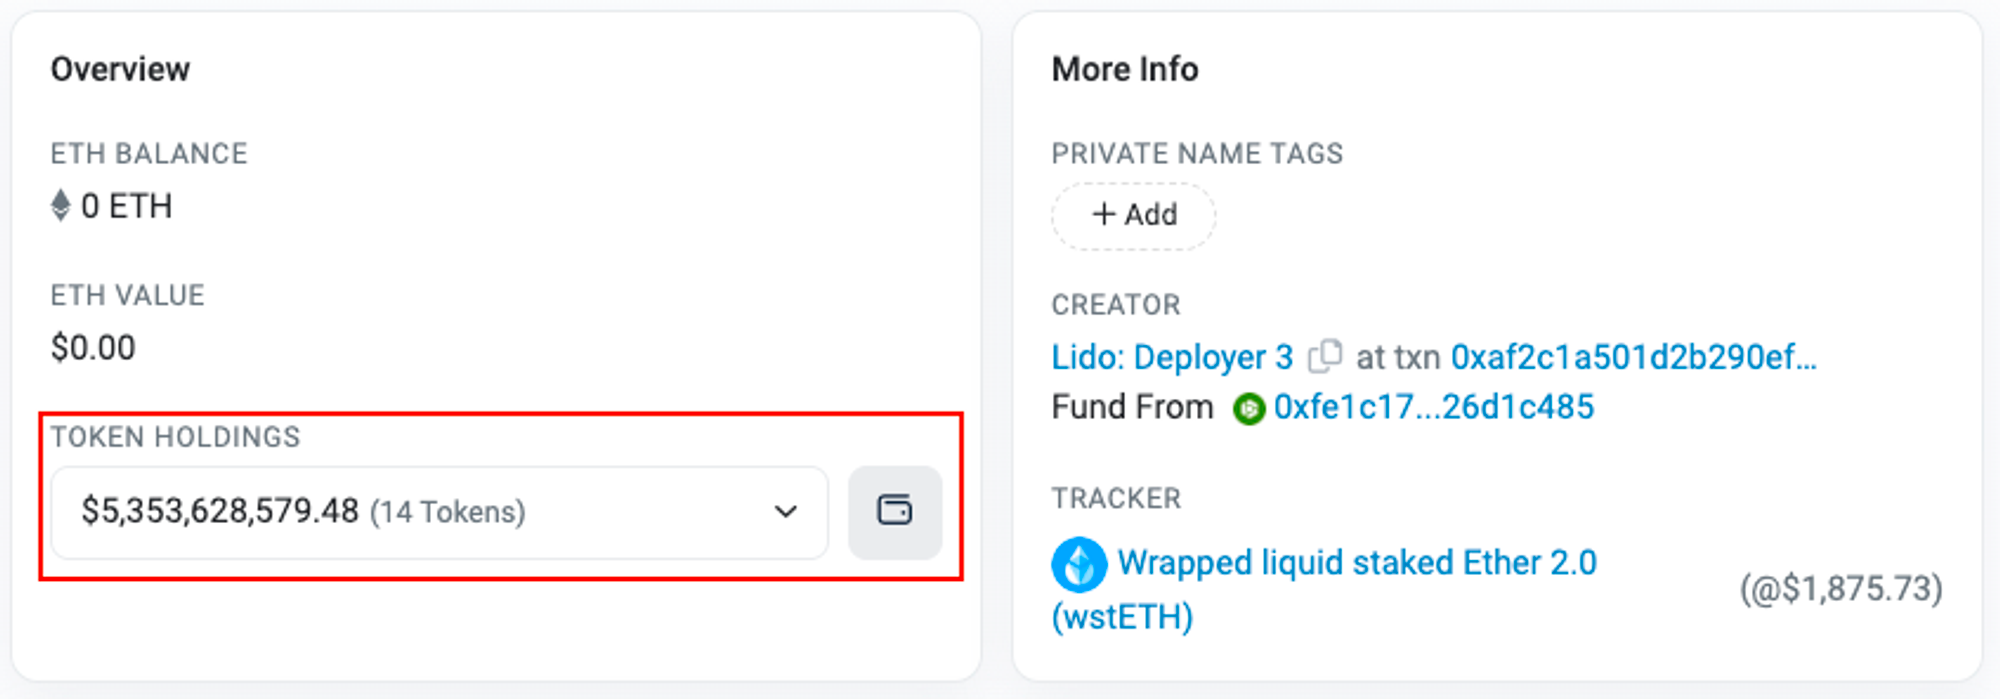
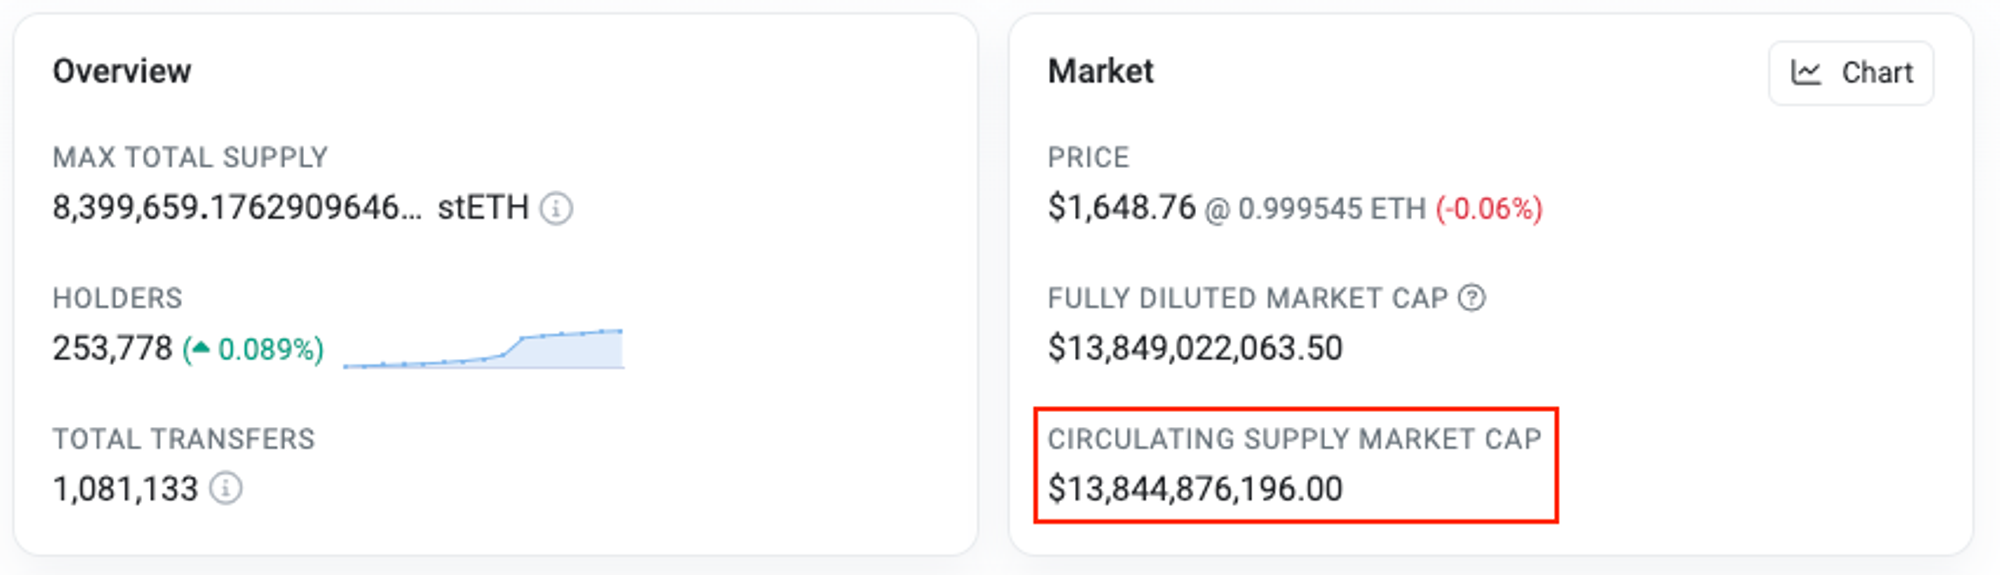
- SY-stETH TVL ≈ 34M , SY-wstETH TVL ≈ 14M | stETH TVL ≈ 8.5B, wstETH TVL ≈ 5.3B
- SY-stETH's TVL is 0.4% of stETH's TVL (≈ 34/8500)
- SY-wstETH's TVL is 0.26% of wstETH's TVL (≈ 14/5300)
- Just an additional 1% of stETH and wstETH TVL could add $138M to Pendle Finance's current TVL level of $130M.

[ RWA ]
As the trend of high interest rates continues, there are various attempts to bring t-bill interests on-chain. For example, MakerDAO offloaded a significant portion of its USDC deposited in PSM off-chain, earned t-bill interests, and then began paying those interest revenues to sDAI, resulting in a sharp increase in DAI issuance.
- About 500M additional DAI issued after Rune's (Maker Founder) tweet guaranteeing 8% APR

Furthermore, seeing MakerDAO successfully utilize RWA in this way, other Dapps (e.g. Frax, Aave) are preparing to utilize t-bill's interests.
- Frax Forum Proposal (onboarding RWA (t-bill yield) partner) — Frax Forum
- Aave Forum Proposal — Aave Forum
In most cases,a bond market can be created on Pendle Finance, as it is more likely to be implemented in the form of a ybtoken when bringing the interest of a t-bill on-chain. In fact, Pendle Finance recently opened bond markets for sDAI and fUSDC. T-bill ybtokens for Frax and Aave may be integrated in the future.
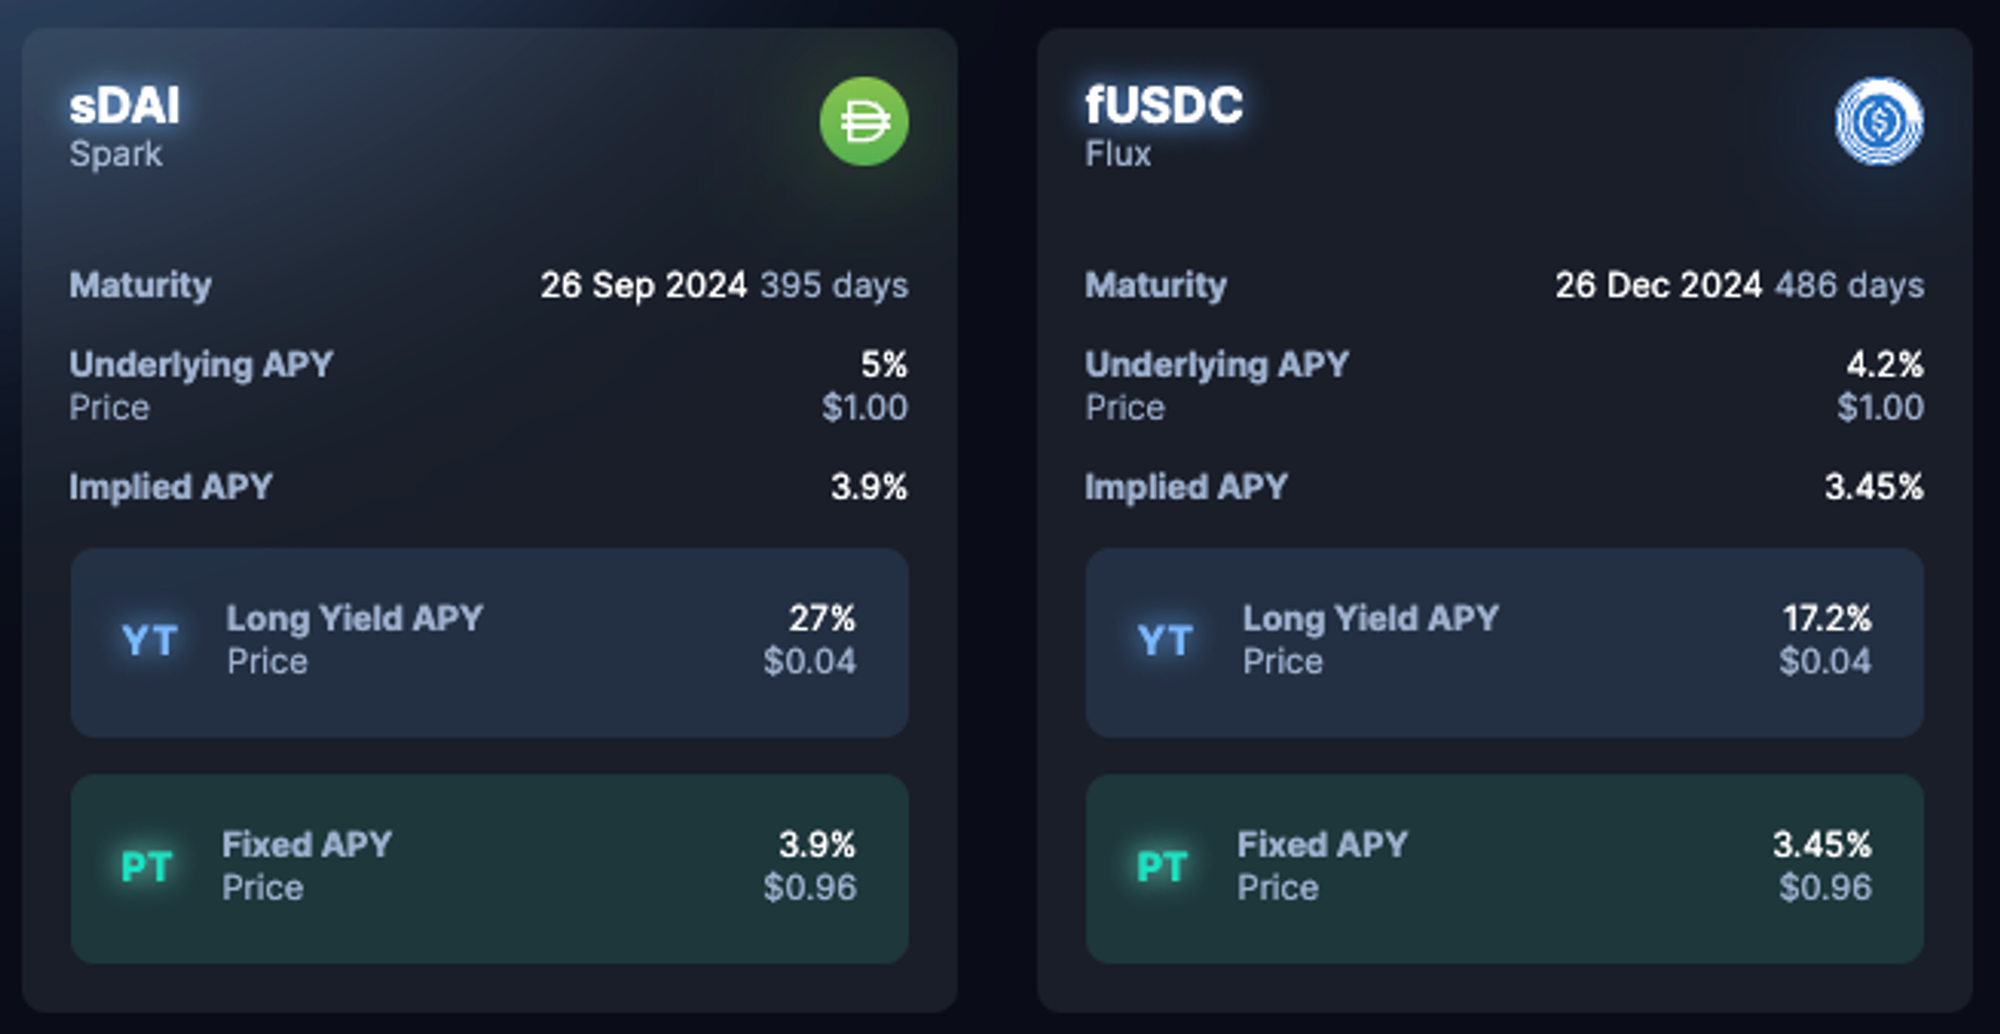
As the bear market continues, on-chain products leveraging stablecoins are earning less than benchmark interest rates. Therefore, Pendle Finance is expected to be at the center of this RWA wave, as products leveraging the interest of t-bills are more than competitive.
3. Limitation: YT Trading Risk
Before diving into yield trading, understanding the relationship between SY, PT, and YT is crucial. It's also essential to grasp how PT and YT are priced. Especially for YT, which is the interest portion of ybtoken, the price is significantly lower than PT, so even a small price change can result in a large loss on the overall position.
- PnL -5% if the price of PT-ABC drops from $20 to $19
- PnL -50% if the price of YT-ABC drops from $2 to $1
For instance, suppose you have a stETH-27AUG2024 bond with a 1-year maturity and the prices of U.APY, I.APY, SY, PT, and YT at the time of market open are shown below.
- U.APY = 4.2%, I.APY = 4%, Date to Maturity = 365d
- SY-stETH = $2,000 | PT-stETH ≈ $1,923 | YT-stETH ≈ $77

If the U.APY drops to 3% and the I.APY drops to 2.5% due to a spike in $ETH staked on the network over 5 days, the price of PT and YT will change as shown below.
- U.APY = 3%, I.APY = 2.5%, Date to Maturity = 360d
- SY-stETH = $2,000 | PT-stETH ≈ $1,952 | YT-stETH ≈ $48

- PT-stETH from $1,923 ==> $1,952 (PnL +1.5%)
- YTstETH from $77 ==> $48 (PNL -37.7%)
An important point to note here is that yield trading ≠ spot trading. In spot trading, you only need to worry about the change in the price of the asset, but in yield trading, you need to consider the change in the U.APY as well as the price of the asset.
- Spot Trading => Focus on $stETH price trend.
- Yield Trading => Have to consider both $stETH price trend and Lido APR movement.
In addition, in order to understand and predict the trend of U.APY, it is necessary to analyze how the Dapps that issue ybtokens work, what is the logic of accumulating interests, whether funds are flowing into the network that the Dapps belong to, and how much growth potential they have compared to competing services.
However, even with this scrutiny, given the sensitivity of the blockchain industry to external factors (e.g., $ETH withdrawals from spot exchanges due to SEC regulation), it is more appropriate to say that U.APY is unpredictable, as it can change due to any number of unforeseen variables.
In other words, a lot of YT trading is based on luck, which makes it difficult to develop an investment strategy and make a profit. Furthermore, if the U.APY is impossible to predict in a product where even a small change in U.APY can have a big impact on a YT trader's return, it is necessary to have a trading tool like SL (Stop Loss) or TP (Take Profit). Yet, these features are currently absent.
While much of the Pendle Finance team's resources are currently focused on chain expansion (e.g., BNB, Optimism), it should be a priority to add the necessary features for trading first in order to build a solid foundation and actually capture the essence of interest rate swaps.
References
- Pendle App
- Pendle DOCS
- GMX Discord
- @hildobby, Dune Dashboard
- Pendle Dashboard
- Etherscan
- Makerburn
- Arbiscan