
Berachain: Building Validator Monitoring Infrastructure
This article was written to contribute to enhancing the Berachain network by leveraging the expertise in DeSpread's infrastructure services.

Following the successful launch of its testnet, Berachain has emerged as a blockchain network that not only boasts compatibility with the Ethereum Virtual Machine (EVM) but also distinguishes itself by being built on the novel Sybil resistance mechanism, the Proof of Liquidity.
With the unveiling of its public testnet on January 8th, Berachain positions itself at the forefront of blockchain innovation, emphasizing speed, resilience, and liquidity tailored for the decentralized finance (DeFi) landscape. This launch has attracted significant interest from the community.
For a deeper understanding of Berachain and its community-driven experimental initiatives, read DeSpread's recent publication, "Berachain — The Convergence of a Strong Community and Experimental Endeavors.”
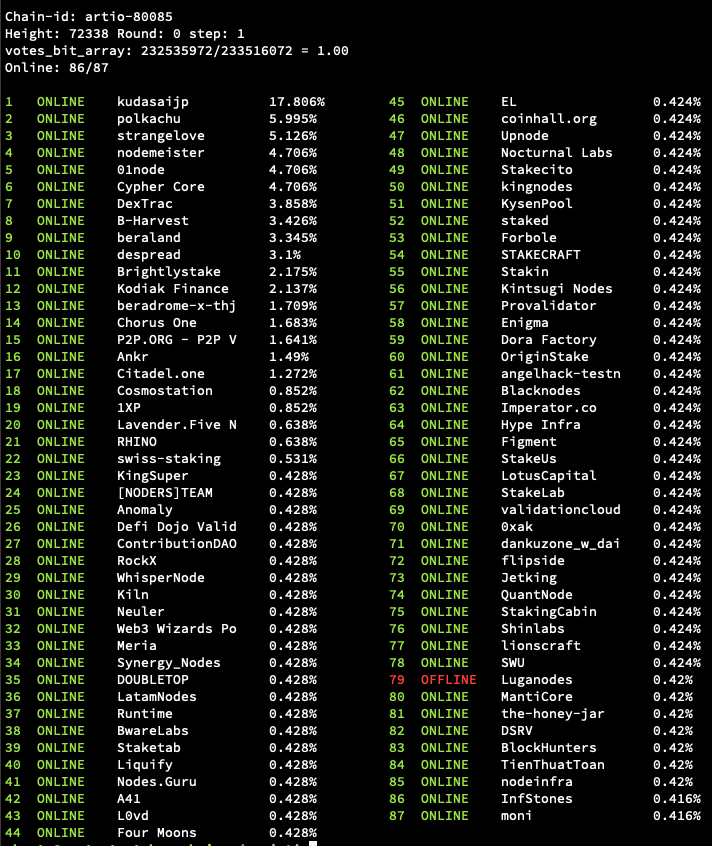
DeSpread has been actively involved with Berachain from the private testnet genesis to the current public testnet. At present, the Berachain testnet validator group includes a total of 102 nodes.
1. The Core Feautres of Berachain
Proof of Liquidity
A notable feature of Berachain is its Proof of Liquidity consensus mechanism. This mechanism ensures that transactions on the network are secure, and reliable. It maintains the integrity of the network and provides a stable and efficient environment, which is particularly crucial in the DeFi ecosystem where transaction speed and reliability are of utmost importance.
Cross-Chain Interoperability
Berachain has fortified its infrastructure by incorporating the Cosmos SDK and Tendermint, a move that significantly boosts its cross-chain interoperability capabilities. This integration is a critical development for the blockchain, as it enables the creation of a robust infrastructure capable of supporting seamless interactions between diverse blockchain ecosystems.
For developers, this feature is of paramount importance. It opens the door to the development of decentralized applications (DApps) that can operate across various blockchain landscapes, promoting a more interconnected and versatile blockchain environment. Such advancements are expected to play a pivotal role in the expansion of Berachain's ecosystem.
Improving EVM Compatibility in Cosmos
In March 2023, Berachain announced the development of the Polaris VM, a project designed to significantly enhance EVM compatibility within the Cosmos ecosystem. Polaris facilitates the process of porting Ethereum-based applications to Berachain, streamlining the development process and maintaining an efficient, developer-friendly environment. This development underscores Berachain's commitment to creating a user-friendly platform that aligns with the needs and preferences of the developer community.
2. Contribution to Berachain Ecosystem
DeSpread, as a genesis validator node of Berachain, aims to contribute to strengthening the Berachain network through its expertise in infrastructure services. Furthermore, as a blockchain infrastructure operator, DeSpread is actively involved in the Berachain ecosystem, exploring and seeking to expand the possibilities within the ecosystem.
2.1. Berachain Infrastructure Dashboard Open Source
To run the validator node stably, engineers must have a comprehensive view of the node's operations through Observability. Instead of making assumptions about the node's performance based on static measurements, accurately understanding performance allows for more stable operations.
Creating a system that enhances Observability is crucial because it can reduce node downtime and shorten the Mean Time To Repair (MTTR), thereby improving the real user experience of the blockchain network.
We believe that validators play a pivotal role in shaping the future of blockchain technology and decentralized finance within the Berachain ecosystem. Because of this, it's critical for engineers to identify and fix problems quickly, especially in the early stages when network optimizations and regular upgrades are common.
Observability consists of three fundamental components: Logs, Metrics, and Tracing. Operating many validator nodes and closely monitoring metric indicators is considered crucial, leading to the idea of making these tools available to the validator community as open source. This approach encourages collaborative improvements, enhances the efficiency of problem resolution, and supports the overall health and reliability of the blockchain network.
2.2. Berachain Validator Node Monitoring
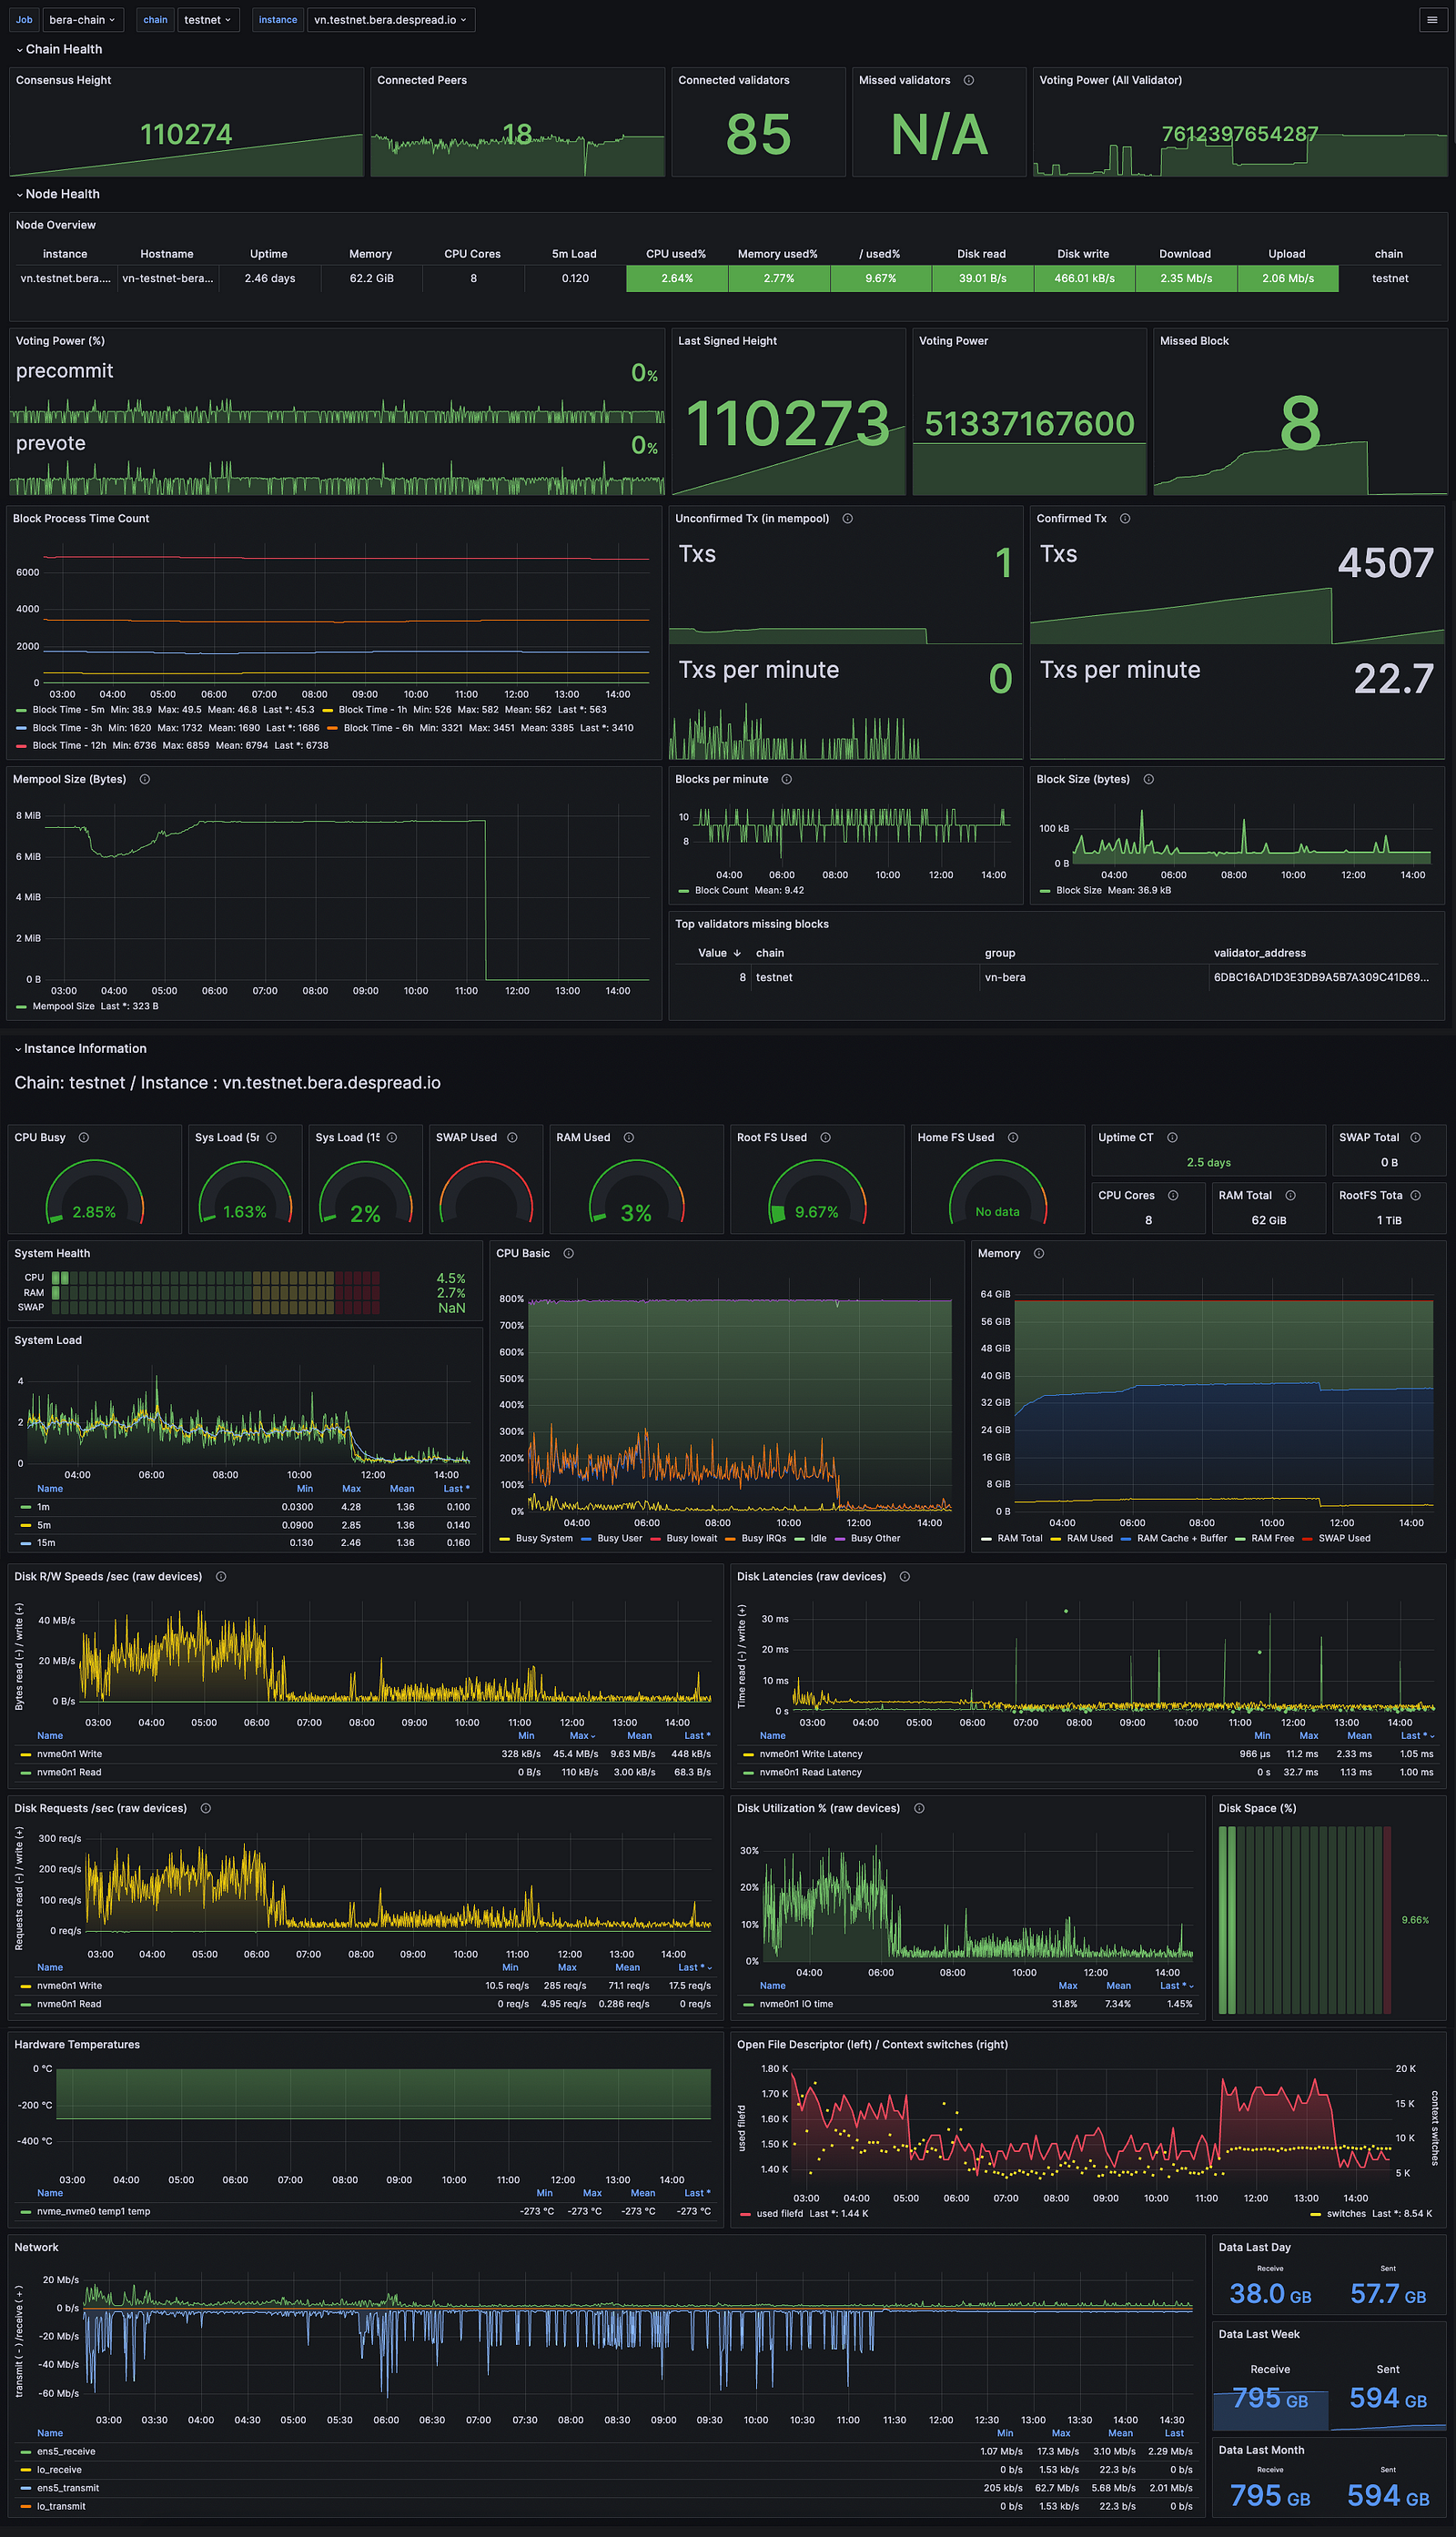
The dashboard above is a Grafana dashboard used by DeSpread for monitoring Berachain's validator nodes. This dashboard has been made available as open source and can be directly imported through the DeSpread GitHub repository or the official Grafana community.
- GitHub Repo: https://github.com/DeSpread/berachain-validator-monitoring
- Official Grafana Community: https://grafana.com/grafana/dashboards/20305-berachain-validator-monitoring
Before starting monitoring with the aforementioned dashboard, there are several preparatory steps you need to take.
2.2.1. Prerequisites
- Prometheus
- Berachain validator node
- Berachain metric exporter
- Node exporter
All processes will be described based on Ubuntu 22.04 LTS.
It is recommended to use an LTS version that is eligible for updates. As of the current standard, Ubuntu's LTS version is v2.45.2.
2.2.2. Launching Prometheus
To ensure you are using the latest packages, you first need to update the package list of your system.
sudo apt update
Create a group and a system user for Prometheus. Use the following command to create a group and then add a user to the group.
sudo groupadd --system prometheus
sudo useradd -s /sbin/nologin --system -g prometheus prometheus
To store configuration files and libraries for Prometheus, you need to create several directories. These directories are located in the /etc and /var/lib directories, respectively. Use the following command to create the directories.
sudo mkdir /etc/prometheus
sudo mkdir /var/lib/prometheus
To download the latest update, go to the official Prometheus website, copy the download link for Linux, and then use wget to download it.
wget https://github.com/prometheus/prometheus/releases/download/v2.45.2/prometheus-2.45.2.darwin-amd64.tar.gz
After the download is complete, execute the following command to extract the contents of the downloaded file.
tar vxf prometheus*.tar.gz
After extracting the file, use the following command to move to the newly extracted Prometheus directory.
cd prometheus*/
Changing to the Prometheus directory allows for easier management and configuration of the installation. Subsequent steps are performed within the context of the Prometheus directory.
You need to navigate to the binary files (prometheus and promtool) and change the file ownership to the prometheus user and group using the following command.
sudo mv prometheus /usr/local/bin
sudo mv promtool /usr/local/bin
sudo chown prometheus:prometheus /usr/local/bin/prometheus
sudo chown prometheus:prometheus /usr/local/bin/promtool
Next, move the configuration files and set the ownership so that Prometheus can access them.
sudo mv consoles /etc/prometheus
sudo mv console_libraries /etc/prometheus
sudo mv prometheus.yml /etc/prometheus
sudo chown prometheus:prometheus /etc/prometheus
sudo chown -R prometheus:prometheus /etc/prometheus/consoles
sudo chown -R prometheus:prometheus /etc/prometheus/console_libraries
sudo chown -R prometheus:prometheus /var/lib/prometheus
prometheus.yml file is the default Prometheus configuration file. It contains settings for targets to monitor, data scraping frequency, and configurations for data processing and storage. Within the file, you can set alerting rules and notification conditions.
sudo vim /etc/prometheus/prometheus.yml
The basic content of a Prometheus file is as follows.
global:
  scrape_interval: 15s # By default, scrape targets every 15 seconds.

  # Attach these labels to any time series or alerts when communicating with
  # external systems (federation, remote storage, Alertmanager).
  external_labels:
    monitor: 'berachain-monitor'

# A scrape configuration containing exactly one endpoint to scrape:
# Here it's Prometheus itself.
scrape_configs:
  # The job name is added as a label `job=<job_name>` to any timeseries scraped from this config.
  - job_name: 'prometheus'

    # Override the global default and scrape targets from this job every 5 seconds.
    scrape_interval: 5s

    static_configs:
      - targets: ['localhost:9090']
In Prometheus, you can scrape the metrics of a Berachain validator node using the following code. It assumes there is a chain tag to capture Prometheus metrics.
The tag is used to switch between testnet and mainnet monitoring, and without the chain label, data will not be displayed on the Grafana dashboard.
## Prometheus.yaml example for node monitoring
# Ensure these are available from the prometheus server.
# 9100 port is prometheus-node-exporter
# 26660 port is the default Bera metrics port
  - job_name: "berachain"
    static_configs:
      - targets: ["vn.testnet.bera.xxxx.com:9100", "vn.testnet.bera.xxxx.com:26660"]
        labels:
          group: "validator"
          chain: "testnet"
  - job_name: "berachain"
    static_configs:
      - targets: ["vn.mainnet.bera.xxxx.com:9100", "vn.mainnet.bera.xxxx.com:26660"]
        labels:
          group: "validator"
          chain: "mainnet"
Now, you need to create a system service file for Prometheus. Use the following command to create and edit the file with the Vim text editor.
sudo vim /etc/systemd/system/prometheus.service
Save the following settings in the file and exit.
[Unit]
Description=Prometheus
Wants=network-online.target
After=network-online.target
[Service]
User=prometheus
Group=prometheus
Type=simple
ExecStart=/usr/local/bin/prometheus \\
    --config.file /etc/prometheus/prometheus.yml \\
    --storage.tsdb.path /var/lib/prometheus/ \\
    --web.console.templates=/etc/prometheus/consoles \\
    --web.console.libraries=/etc/prometheus/console_libraries
[Install]
WantedBy=multi-user.target
To ensure the system recognizes changes to prometheus.service, you need to reload the system configuration files after saving them. Use the following command to reload the system configuration files.
sudo systemctl daemon-reload
Next, to enable and start the Prometheus service, you would use the following commands.
sudo systemctl enable prometheus
sudo systemctl start prometheus
After starting the Prometheus service, you can use the following command to check if the service is running or if any errors have occurred.
sudo systemctl status prometheus
Since Prometheus basically runs on port 9090, you need to allow port 9090 through the firewall.
sudo ufw allow 9090/tcp

Once Prometheus is running successfully, you can access it through a web browser using localhost:9090 or <ip_address>:9090.
2.2.3. Launching Berachain Validator Node
There are three methods for installing a Berachain validator node:
- Pre-built binary
- Docker
- Direct binary compile
This article is following method 1 since the Berachain team currently recommends using the pre-built binary.
Access the Berachain docs and refer to the binary section. Use the following command to set up the berad binary.
mv <path_to_berad_download> /usr/local/bin/berad
Now, you can use the Berachain CLI with the berad command.
After configuring according to the official Berachain validator node setup documentation, you can run the validator node.
Detailed information about operating a validator node is not publicly disclosed.
2.2.4. Launching Berachain Metric Exporter
After installing and running the Berachain binary, the API exposure feature is turned off by default, making it impossible to view metric indicators.
To scrape metric indicators from the validator node in Prometheus, you need to enable the API in the app.toml configuration as follows.
[api]
# Enable defines if the API server should be enabled.
enable = true
It is important to note that the Berachain team recommends not activating or exposing the RPC port to public traffic. This is to reduce the risk of validator nodes being taken down by DDoS attacks.
Therefore, it is strongly advised to enable the API settings and allow API communication only to the Prometheus server through a firewall like iptable or security settings within the cloud provider.
2.2.5. Launching Node Exporter
Node exporter allows you to measure system resources of a node, such as memory, disk, and CPU usage.
You can install node exporter using the following command.
sudo apt-get update
sudo apt-get install prometheus-node-exporter -y
sudo systemctl status prometheus-node-exporter
After installing the node-exporter package, you should fetch system metrics from http://localhost:9100 or http://<ip_address>:9100.
Port 9100 is the default port for node-exporter.
2.3. Using Berachain Monitoring Dashboard
Having installed and configured all the necessary tools beforehand, you are now ready to import and use the Berachain validator monitoring dashboard.

Access the Import page from the dashboard page as described.
In Grafana, there are three ways to import a dashboard:
- Import a JSON file.
- Enter the dashboard ID uploaded to the Grafana community.
- Directly enter the JSON model.
Among these, the simplest method is the second one. Our open-source dashboard ID is 20305.

In the Import page, you can further specify the name, folder, and the UID (Unique Identifier) of the dashboard.

Once the import is complete, you will be able to see the dashboard for monitoring the validator node.
3. Learn More About Berachain

For those interested in delving into the technology and potential of Berachain, you can explore in detail through Berachain's official website and GitHub repository.
- Official Berachain website: https://berachain.com
- Berachain Twitter: https://twitter.com/berachain
- Berachain GitHub: https://github.com/berachain
4. Conclusion
Since the genesis of Berachain, DeSpread has been participating as a validator, continually exploring ways to further contribute to the Berachain ecosystem.
While actively communicating with many teams in Berachain's validator community, a significant issue that a considerable number of validator teams were unable to monitor their validator nodes on Berachain was identified. Recognizing this need within the community, DeSpread swiftly prepared and released an open-source dashboard for monitoring validator nodes. Feedback and PR for this GitHub repository are always welcome.
We hope this article helps the validator community and Berachain build a secure and strong network, and we look forward to contributing to the Berachain ecosystem in the future.