
DI - 04: Market Commentary | 07. 02.
Crypto Market Trends in Data

1. Introduction
After enduring a prolonged bear market, discussions surrounding the potential approval of a Bitcoin ETF sparked a significant uptrend starting in October 2023. Now, eight months into 2024, Bitcoin (BTC), which was hovering around $27K, has surged by approximately 130%, reaching around $61K and peaking at $73K. This article reviews the overall trends and movements in the cryptocurrency market during this period and explores the changes that have occurred.
2. Market Trends and ETF
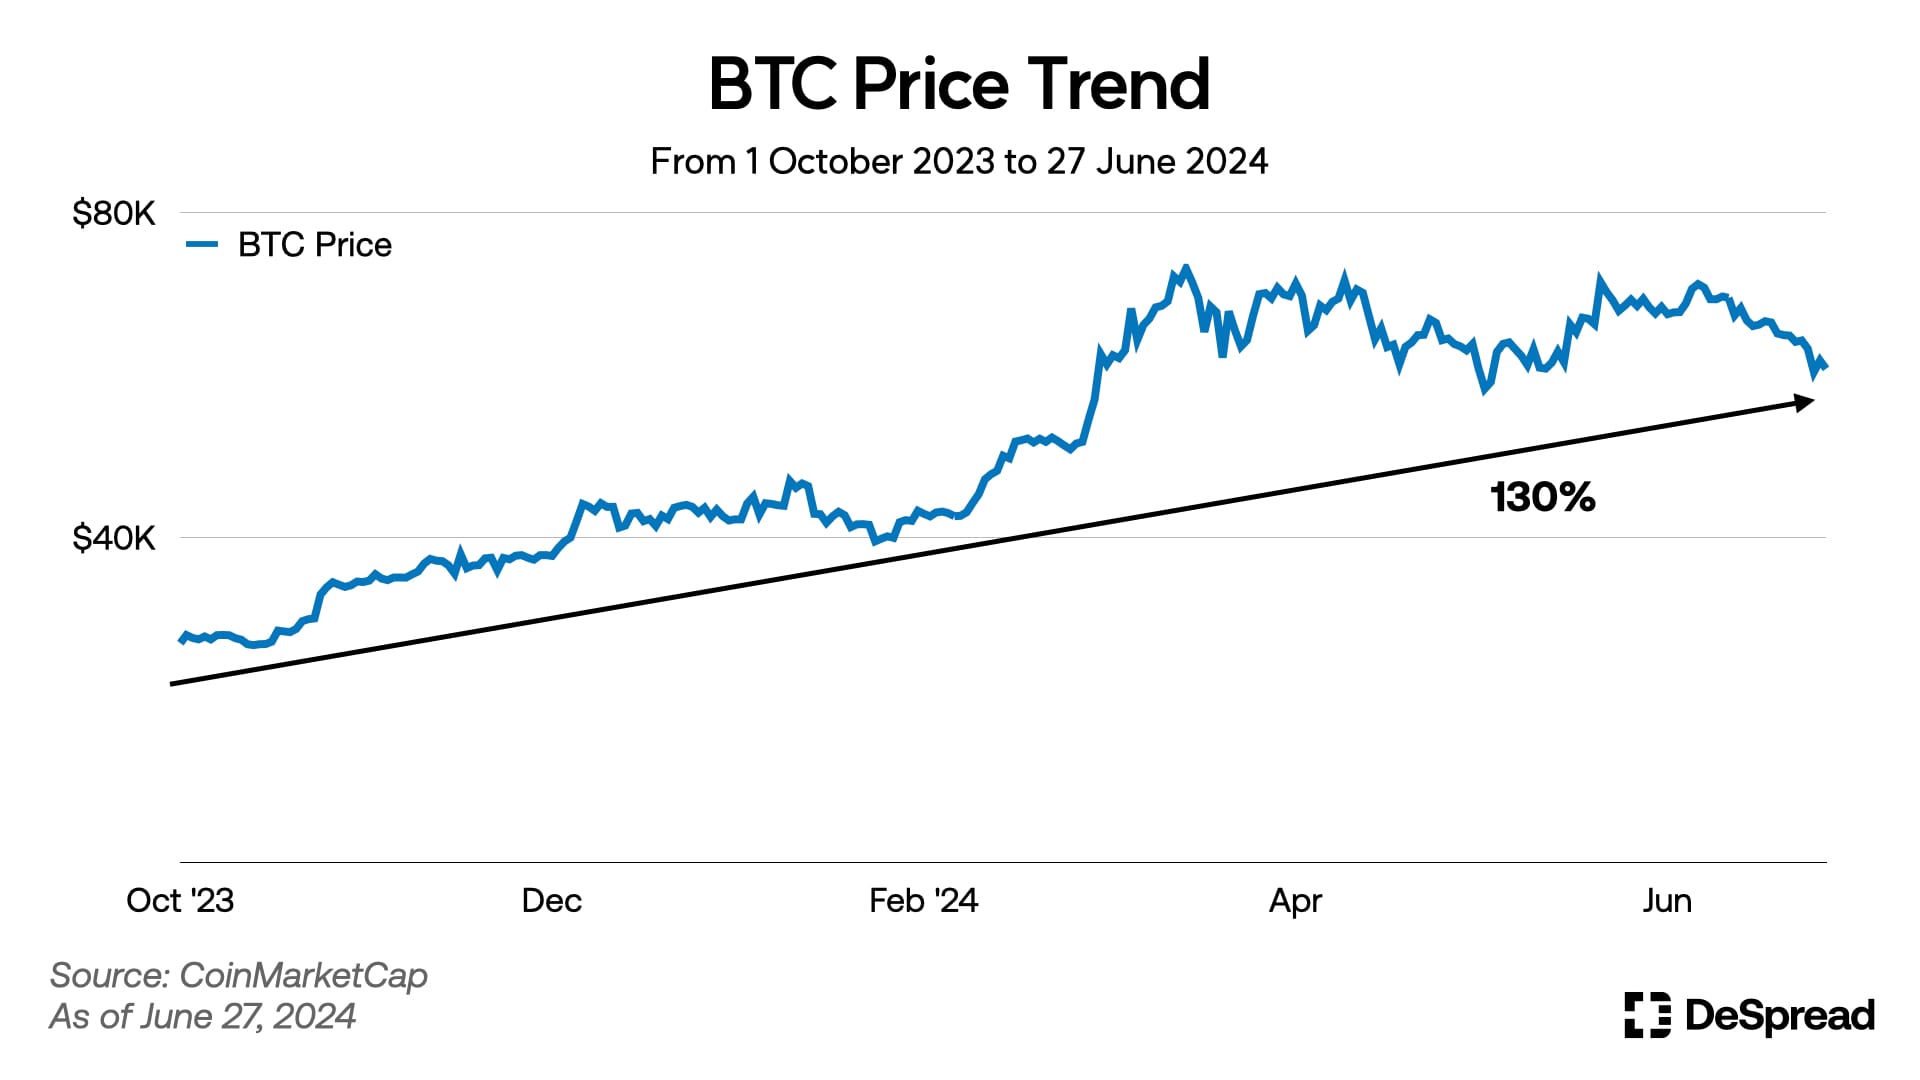
Since the approval of the Bitcoin spot ETF began to appear likely, the price of Bitcoin has seen explosive growth. As previously mentioned, it has recorded an approximate 130% increase. From the ETF approval price of $46K on January 10, 2024, Bitcoin has risen by about 35%.
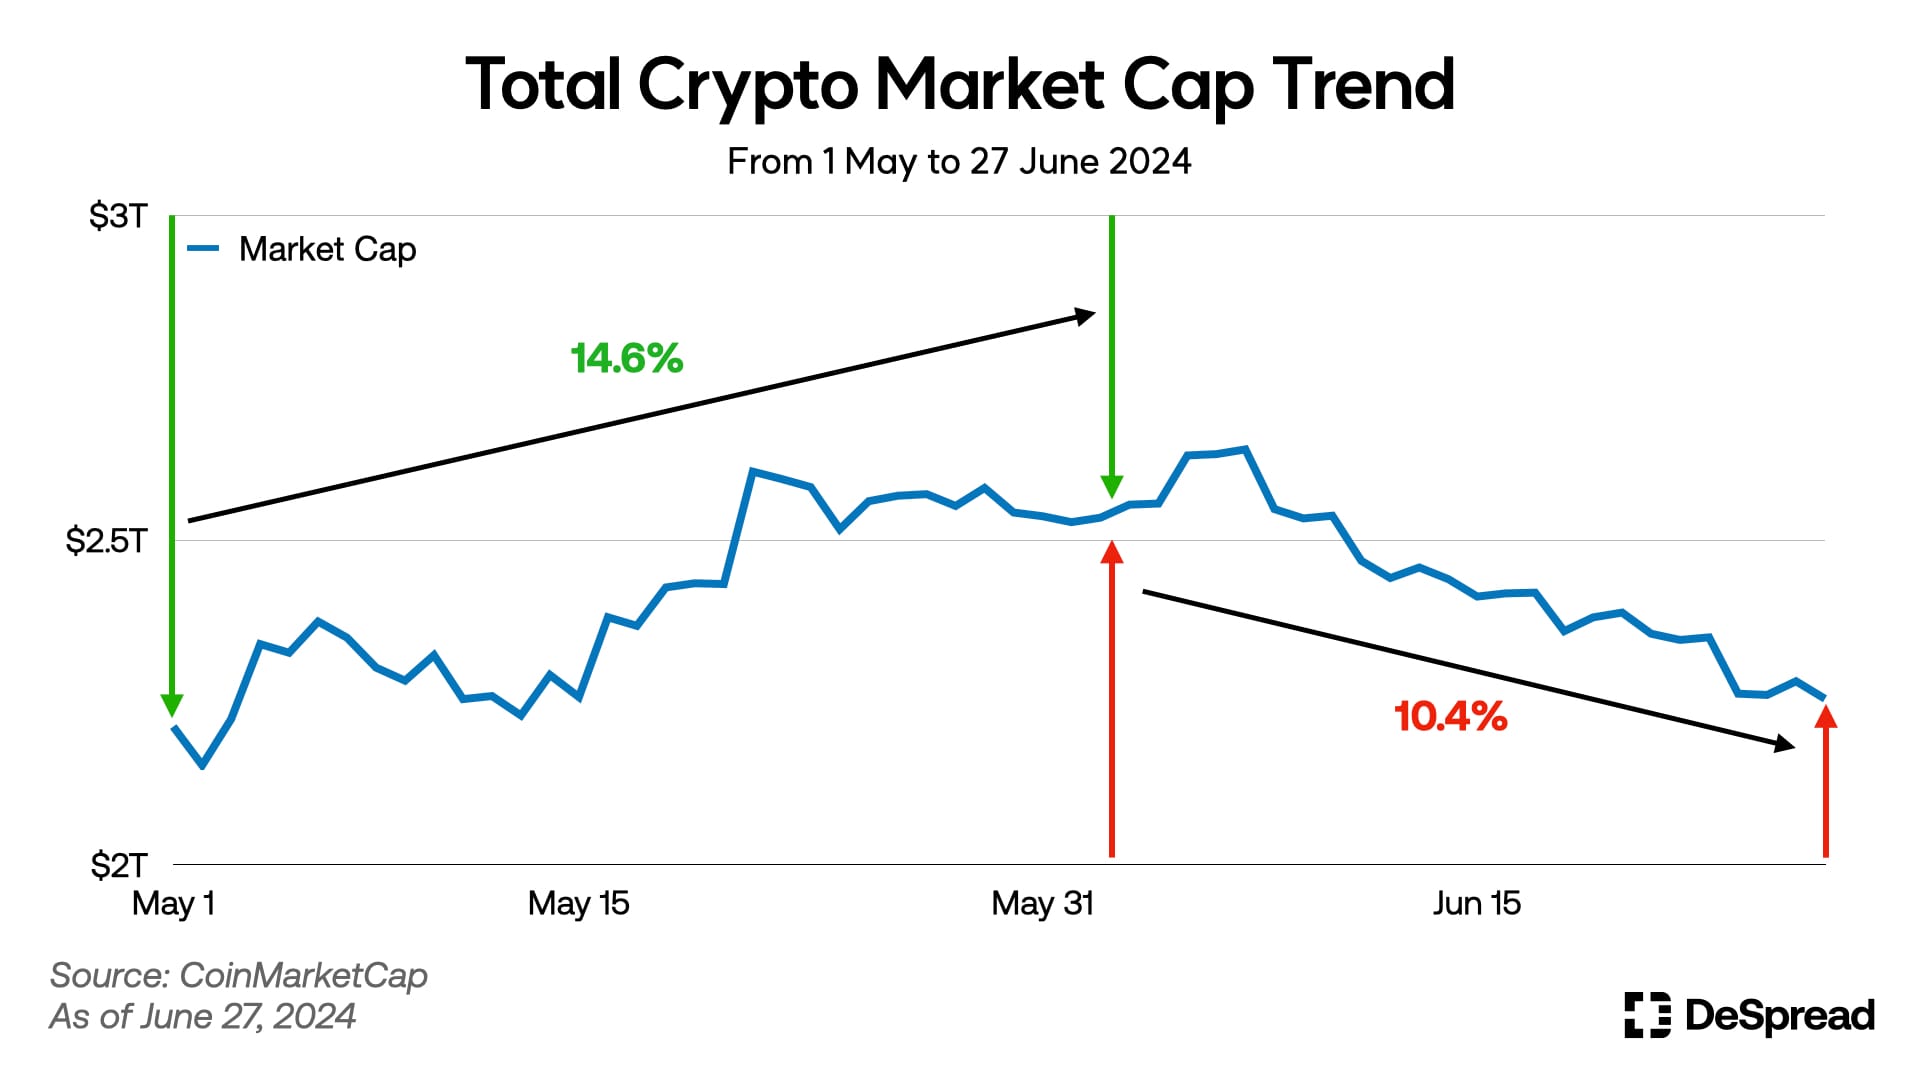
However, the current market conditions perceived by participants are less favorable than expected. In May, the total market capitalization of the cryptocurrency market increased by 14.6%. In contrast, June witnessed a decline of over 10%, indicating significant volatility.
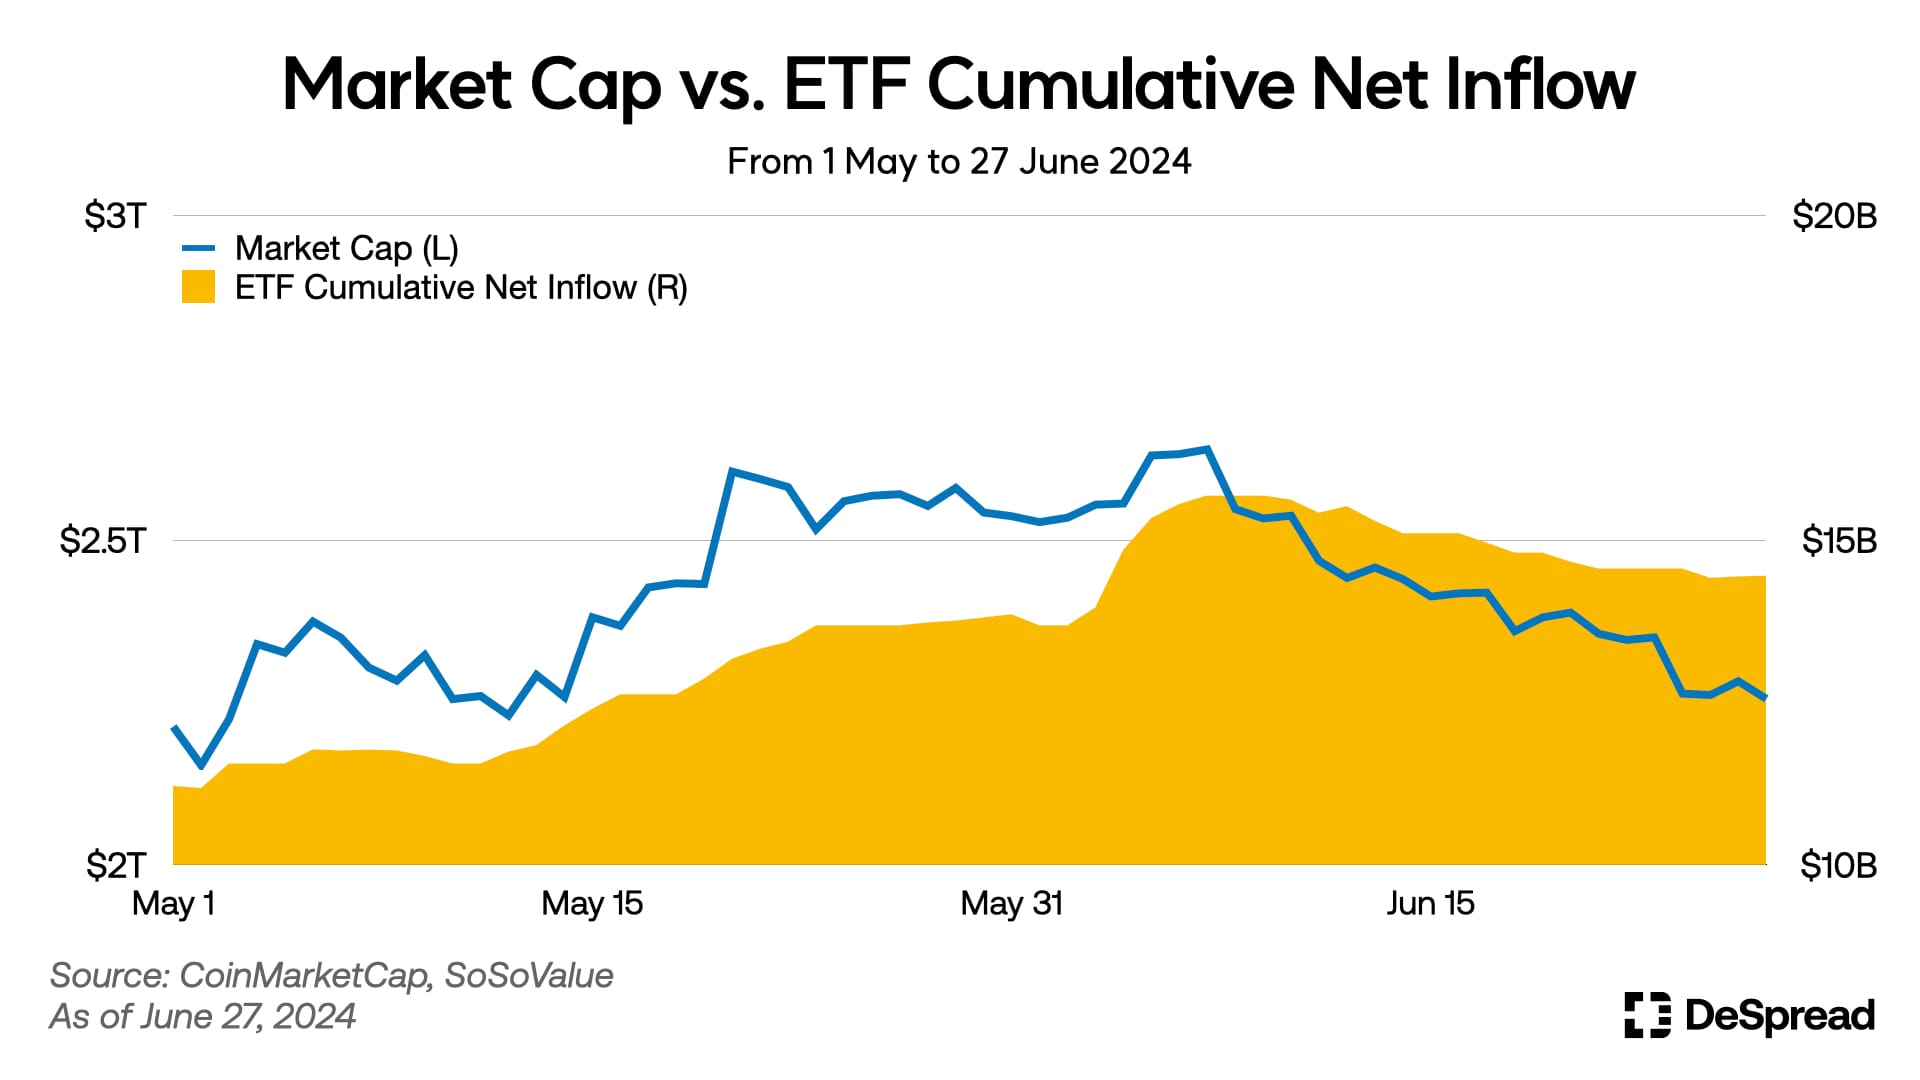
Since the approval of the Bitcoin spot ETF on January 10, the following indicators have been observed as of June 27:
- Total net assets of the spot ETF: $53.13 billion (4.38% of Bitcoin's total market capitalization)
- Cumulative net fund inflows: $14.45 billion
Although the total net assets held by the spot ETF constitute less than 5% of Bitcoin's total market capitalization, the daily net fund inflows and Bitcoin's market capitalization have shown similar trends since the ETF's approval. There is a high correlation between these two figures. Even during the overall market downturn in June, the net fund inflows to the ETF continued to show an outflow trend.
[Weekly Indicators for ETF and Bitcoin Prices]
- First week of June (06.03 - 06.07)
- ETF Net Inflows: ~$1.8B
- BTC Price: $69,325
- Weekly BTC Return: 2.74%
- Second week of June (06.10 - 06.14)
- ETF Net Inflows: ~-$580M
- BTC Price: $66,011
- Weekly BTC Return: -4.78%
- Third week of June (06.17 - 06.21)
- ETF Net Inflows: ~-$544M
- BTC Price: $64,072
- Weekly BTC Return: -2.94%
- Fourth week of June (06.24 - 06.28)
- ETF Net Inflows: ~-$37M
- BTC Price: $60,317
- Weekly BTC Return: -5.86%
3. Korean Centralized Exchanges
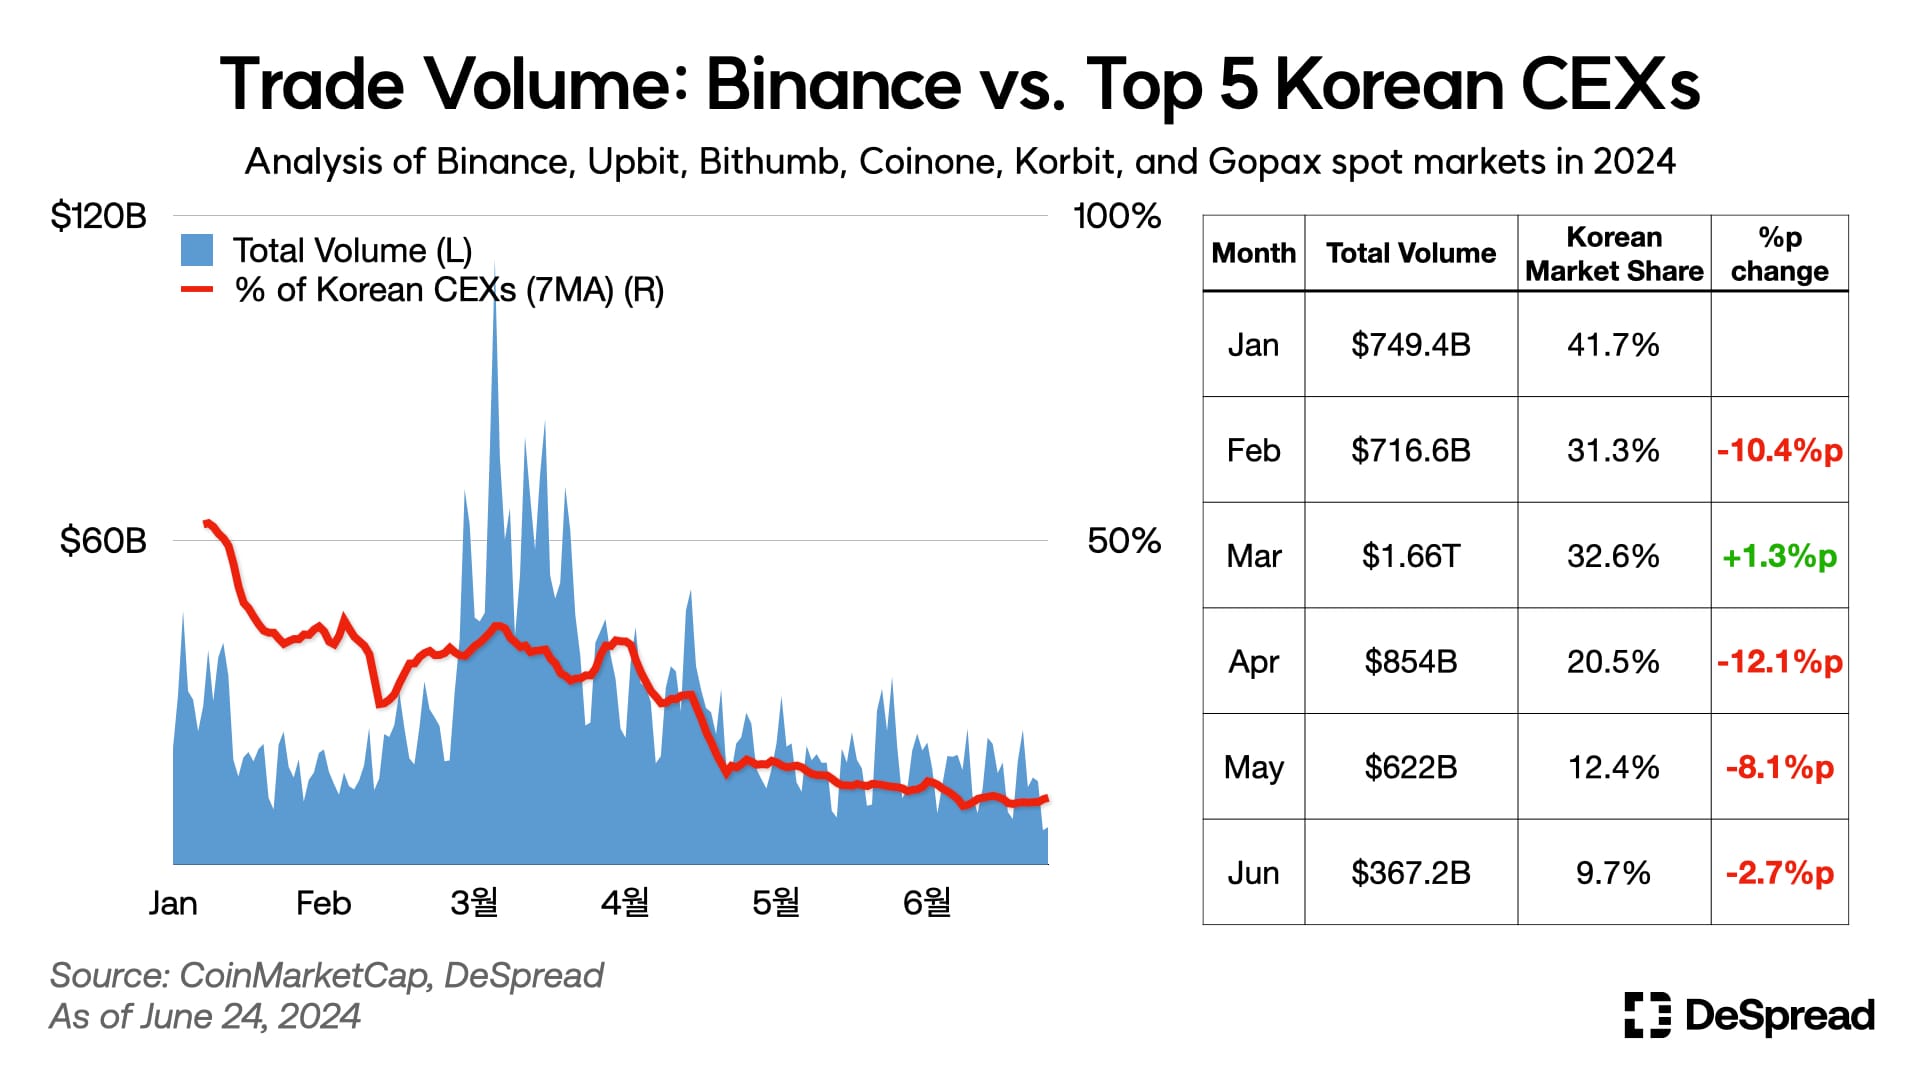
An analysis of the spot markets of Binance and the top 5 korean exchanges (Upbit, Bithumb, Coinone, Korbit, Gopax) reveals the following trends in centralized exchange trading volumes:
- In March 2024, the total monthly trading volume on centralized exchanges peaked at $1.66 trillion.
- The combined trading volume of korean exchanges (7-day moving average) once exceeded 50% of the total trading volume in January, surpassing Binance's spot trading volume. However, this share has gradually declined, recording around 30% in February and March, 20% in April, and falling to the 10% range since May.
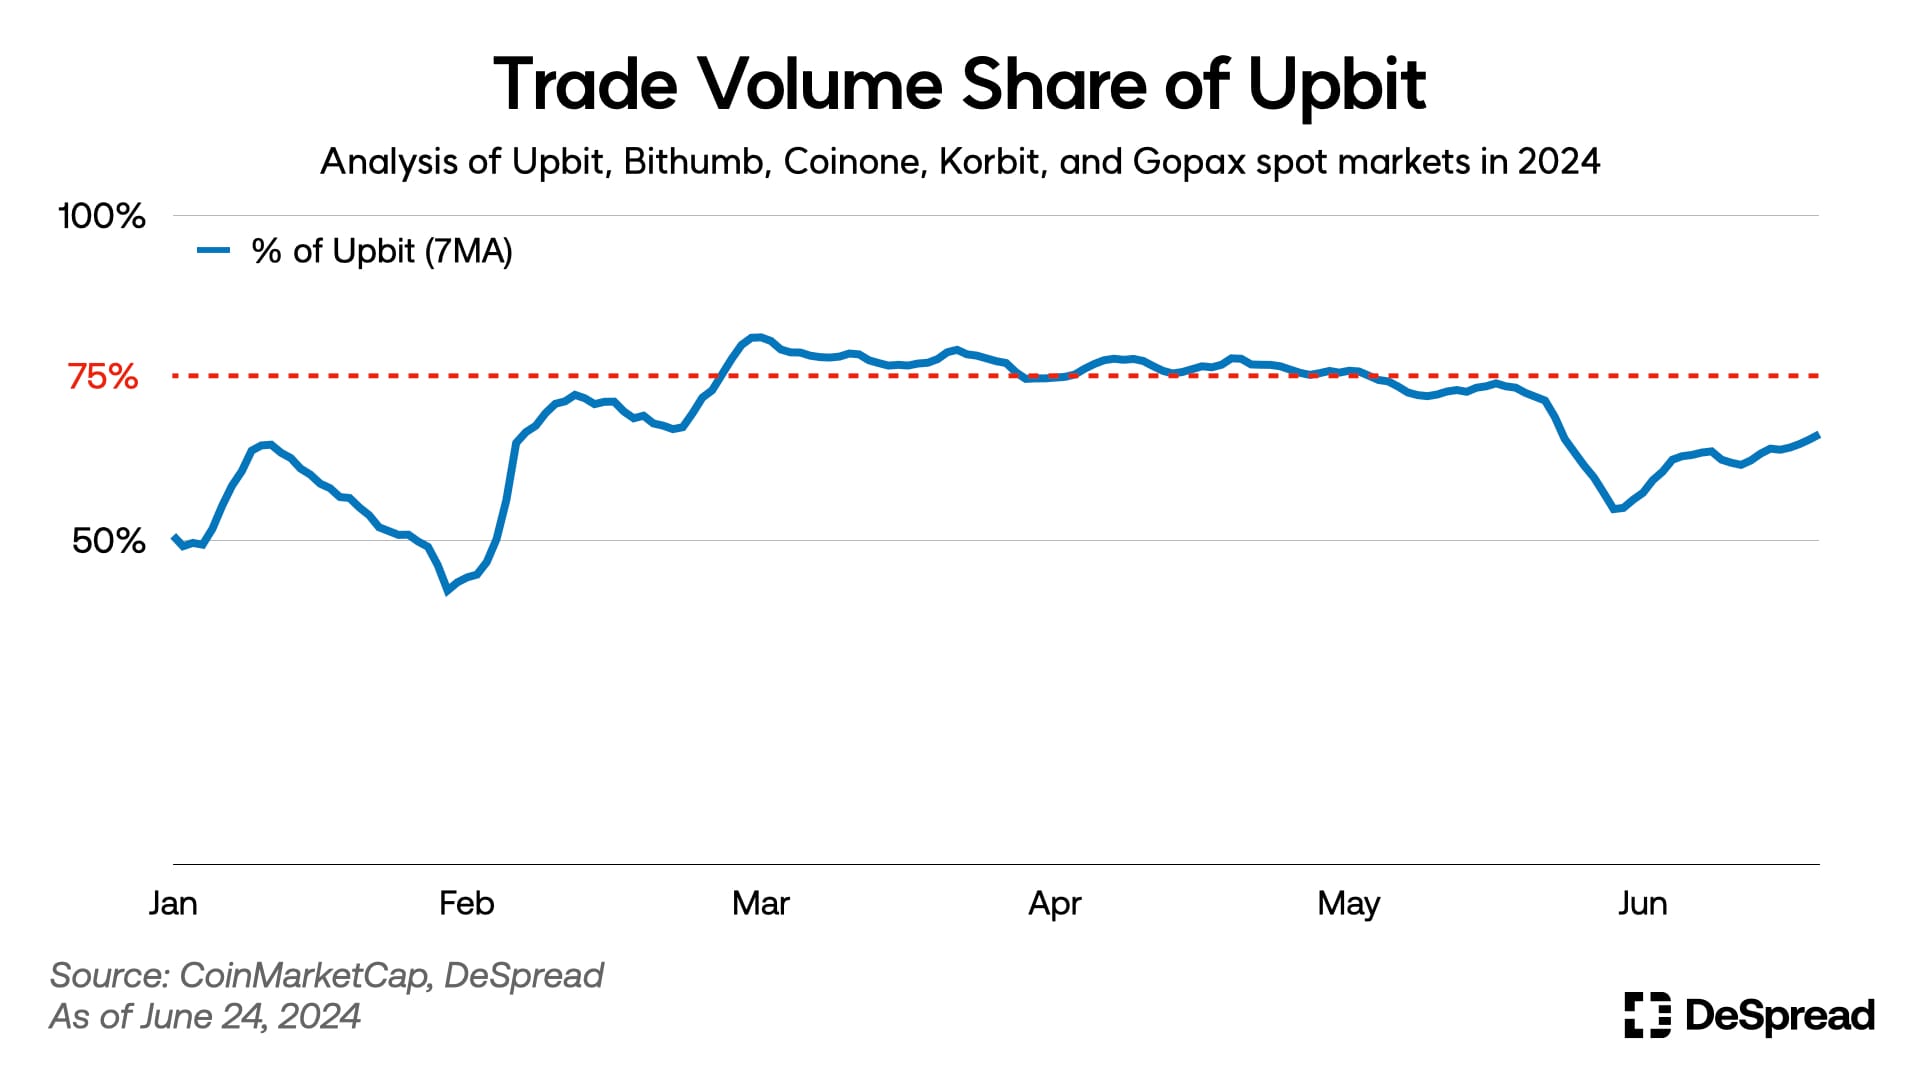
During the same period, there were notable shifts in the market share landscape among korean exchanges. As mentioned in "DI - 01: Korean Centralized Exchanges," Upbit previously dominated with nearly 80% of the korean market share. However, starting in January this year, its 7-day average market share plummeted to the 50-60% range and even fell below 50% at one point in February.
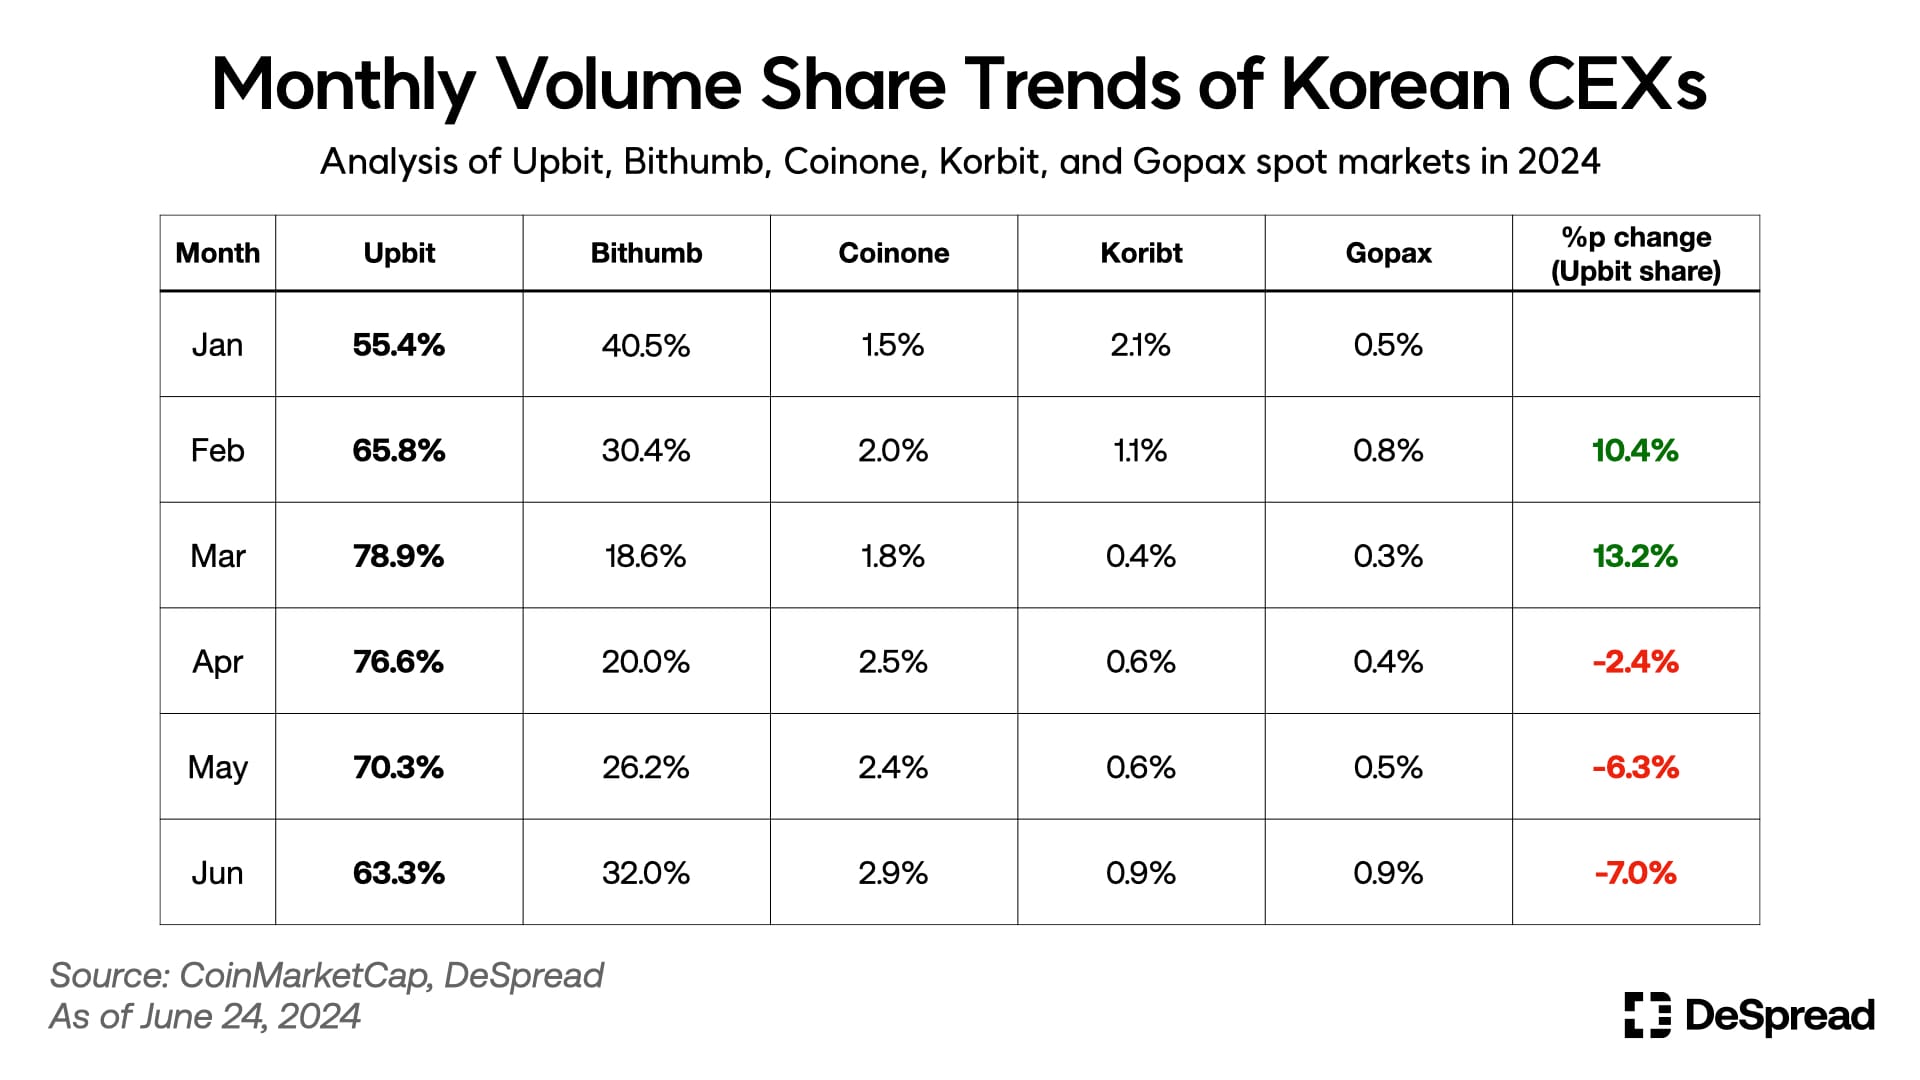
With the overall increase in trading volume in the cryptocurrency market, Upbit's market share rebounded, reaching approximately 75% by May. However, in June, it saw another decline, currently holding around 60% of the market share. This trend is clearly visible when examining the monthly market share distribution of korean exchanges.
4. On-Chain Trends (Ethereum vs. Solana)
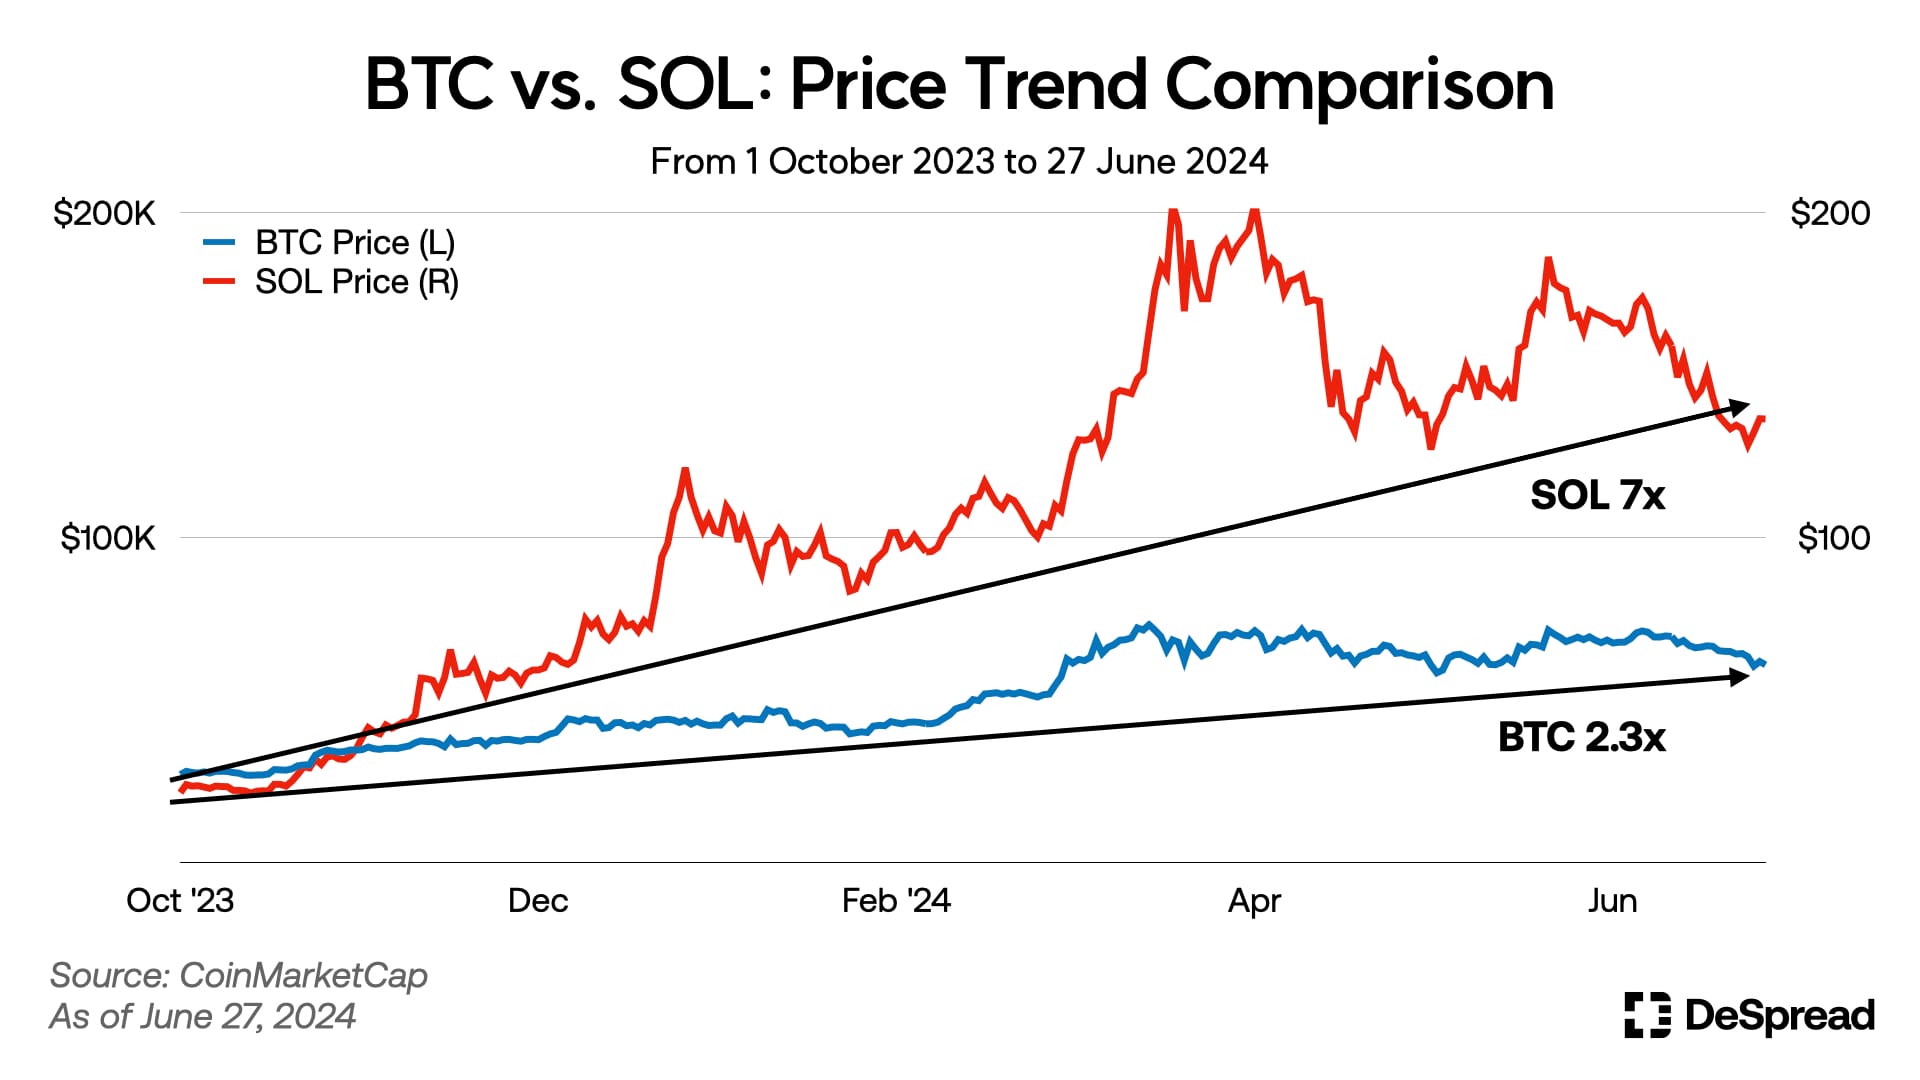
In the recent uptrend of the cryptocurrency market, Solana (SOL) has been a standout performer. While Bitcoin (BTC) saw its price increase by approximately 2.3 times, Solana surged more than sevenfold, propelling it to the fifth-largest market capitalization in the global cryptocurrency market.
This remarkable growth is particularly striking considering Solana's price had fallen below $10 as of December 30, 2022, following the fallout from the FTX bankruptcy in 2022. This dramatic recovery highlights Solana's significant resilience and growth potential.
For more detailed information on the history of Solana, please refer to the article "Solana — From the FTX Bankruptcy to Solana Summer 2.0."
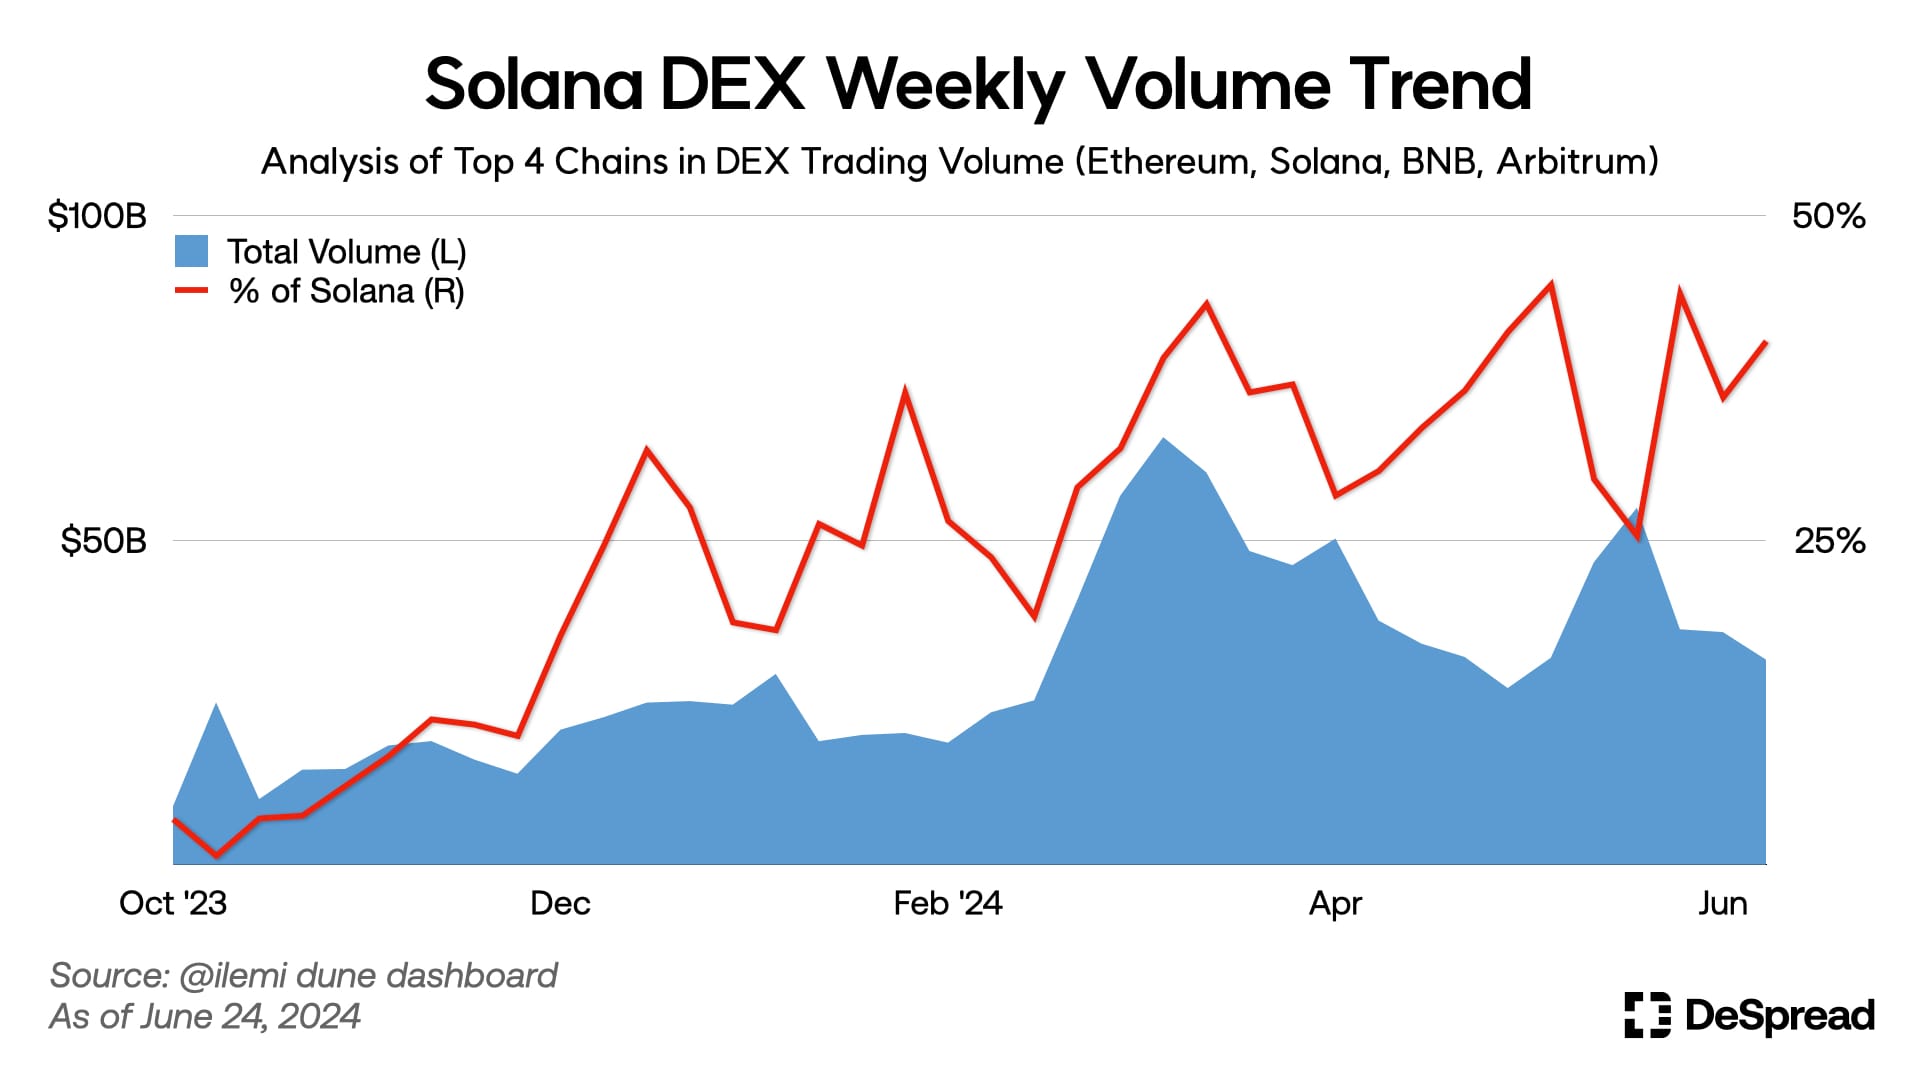
Solana, which aimed to be the "Ethereum Killer" with its focus on high scalability, has demonstrated these qualities during the recent bull market. Analyzing the top four DEX chains—Ethereum, Solana, BNB Chain, and Arbitrum—reveals that Solana, which had low on-chain trade volumes as of October 2023, saw a significant increase starting in December of that year. Solana's on-chain trade volume has now reached approximately 40% of the total.
Several factors have contributed to this rise:
- High demand for promising projects and their tokens within the Solana ecosystem, such as Jupiter, Jito, Tensor, Backpack Exchange, and Wormhole.
- Improvements in on-chain trading functionality led by Jupiter.
- The popularity of meme coin creation and trading metas, exemplified by platforms like Pump.fun.
These elements combined to drive the substantial growth in Solana's trade volumes and market presence.
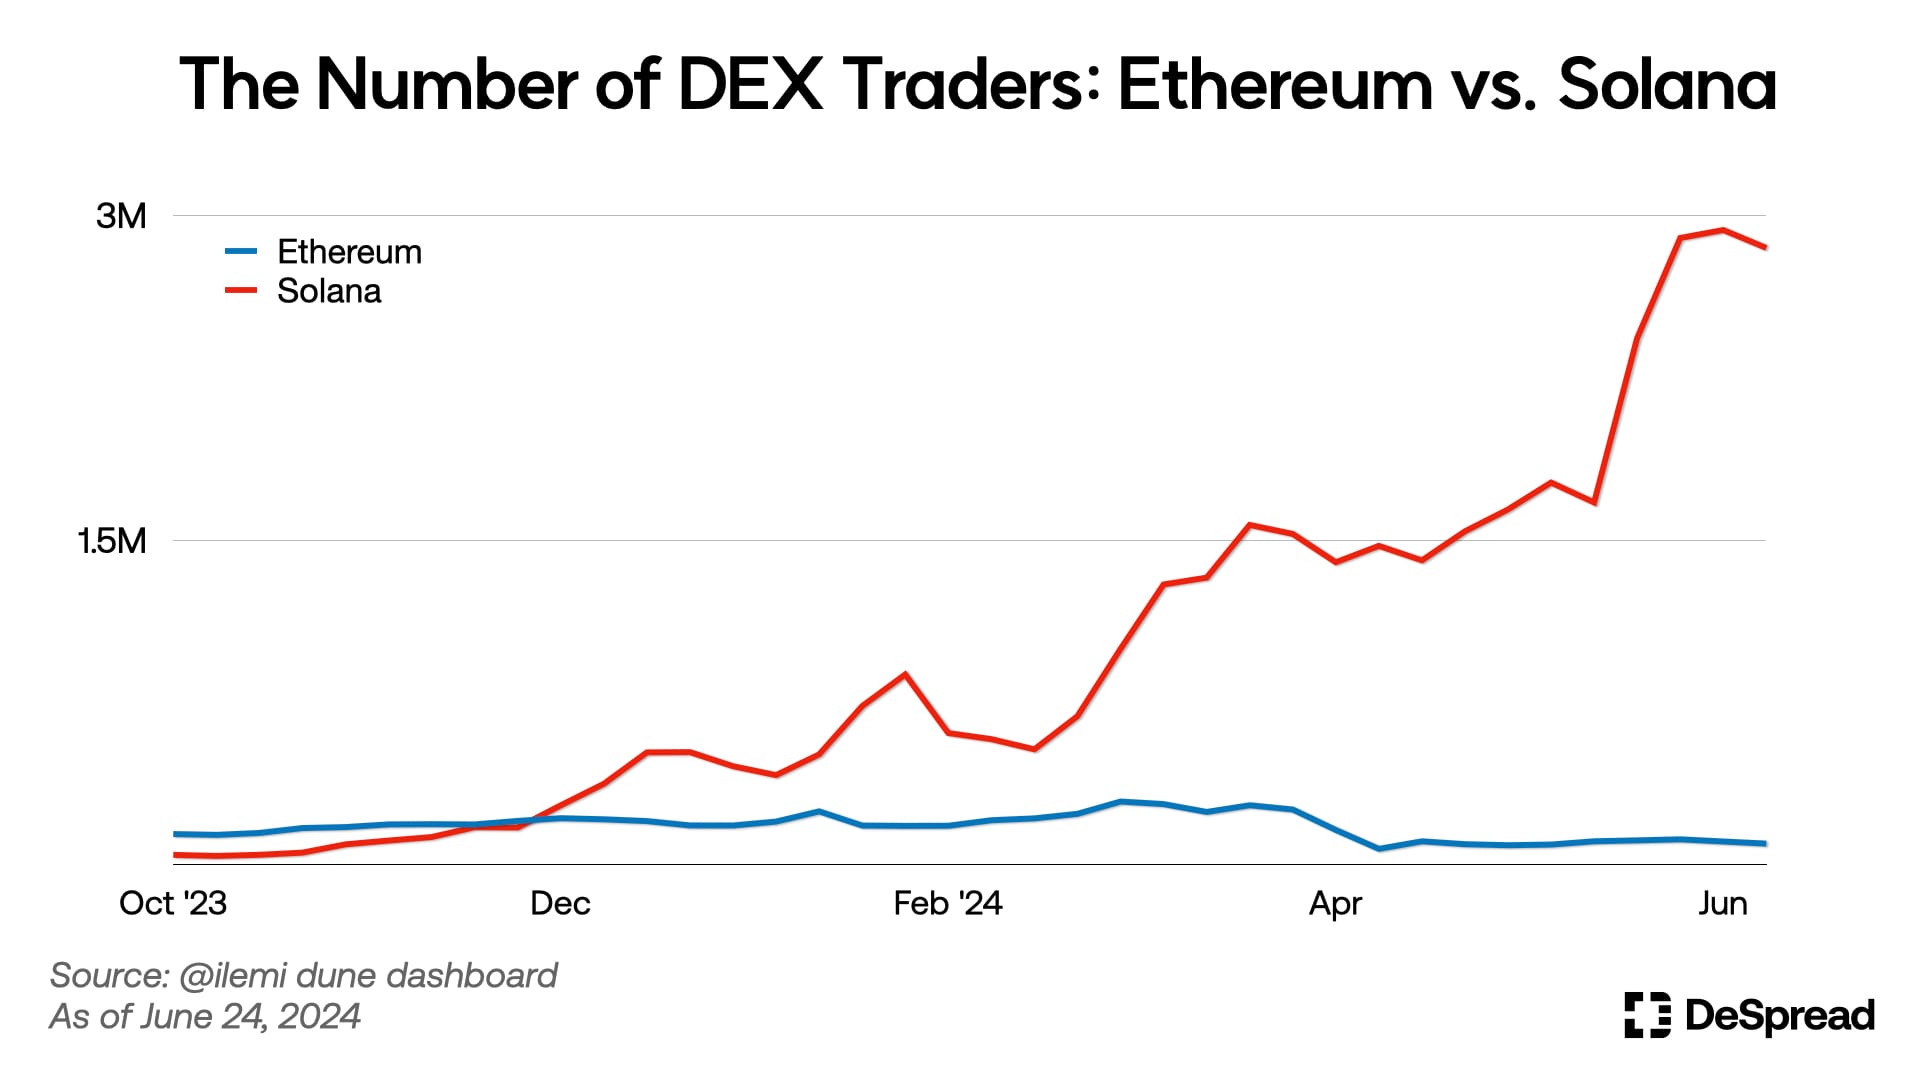
As evidence of the aforementioned reasons, the number of on-chain traders on Solana has significantly increased over time. In early October 2023, Solana had around 40,000 weekly on-chain traders. By early December, this number had surged to approximately 270,000, surpassing Ethereum. Currently, Solana has nearly 3 million on-chain traders.
During the same period, Ethereum's weekly on-chain trader numbers have remained steady at around 100,000 to 200,000. This distinction highlights the differing on-chain trading behaviors between the two chains. Solana's on-chain traders tend to engage in frequent transactions with smaller funds, while Ethereum's traders typically handle larger funds per transaction.
This difference in trading behavior can be attributed to the variance in transaction fees between the two chains.
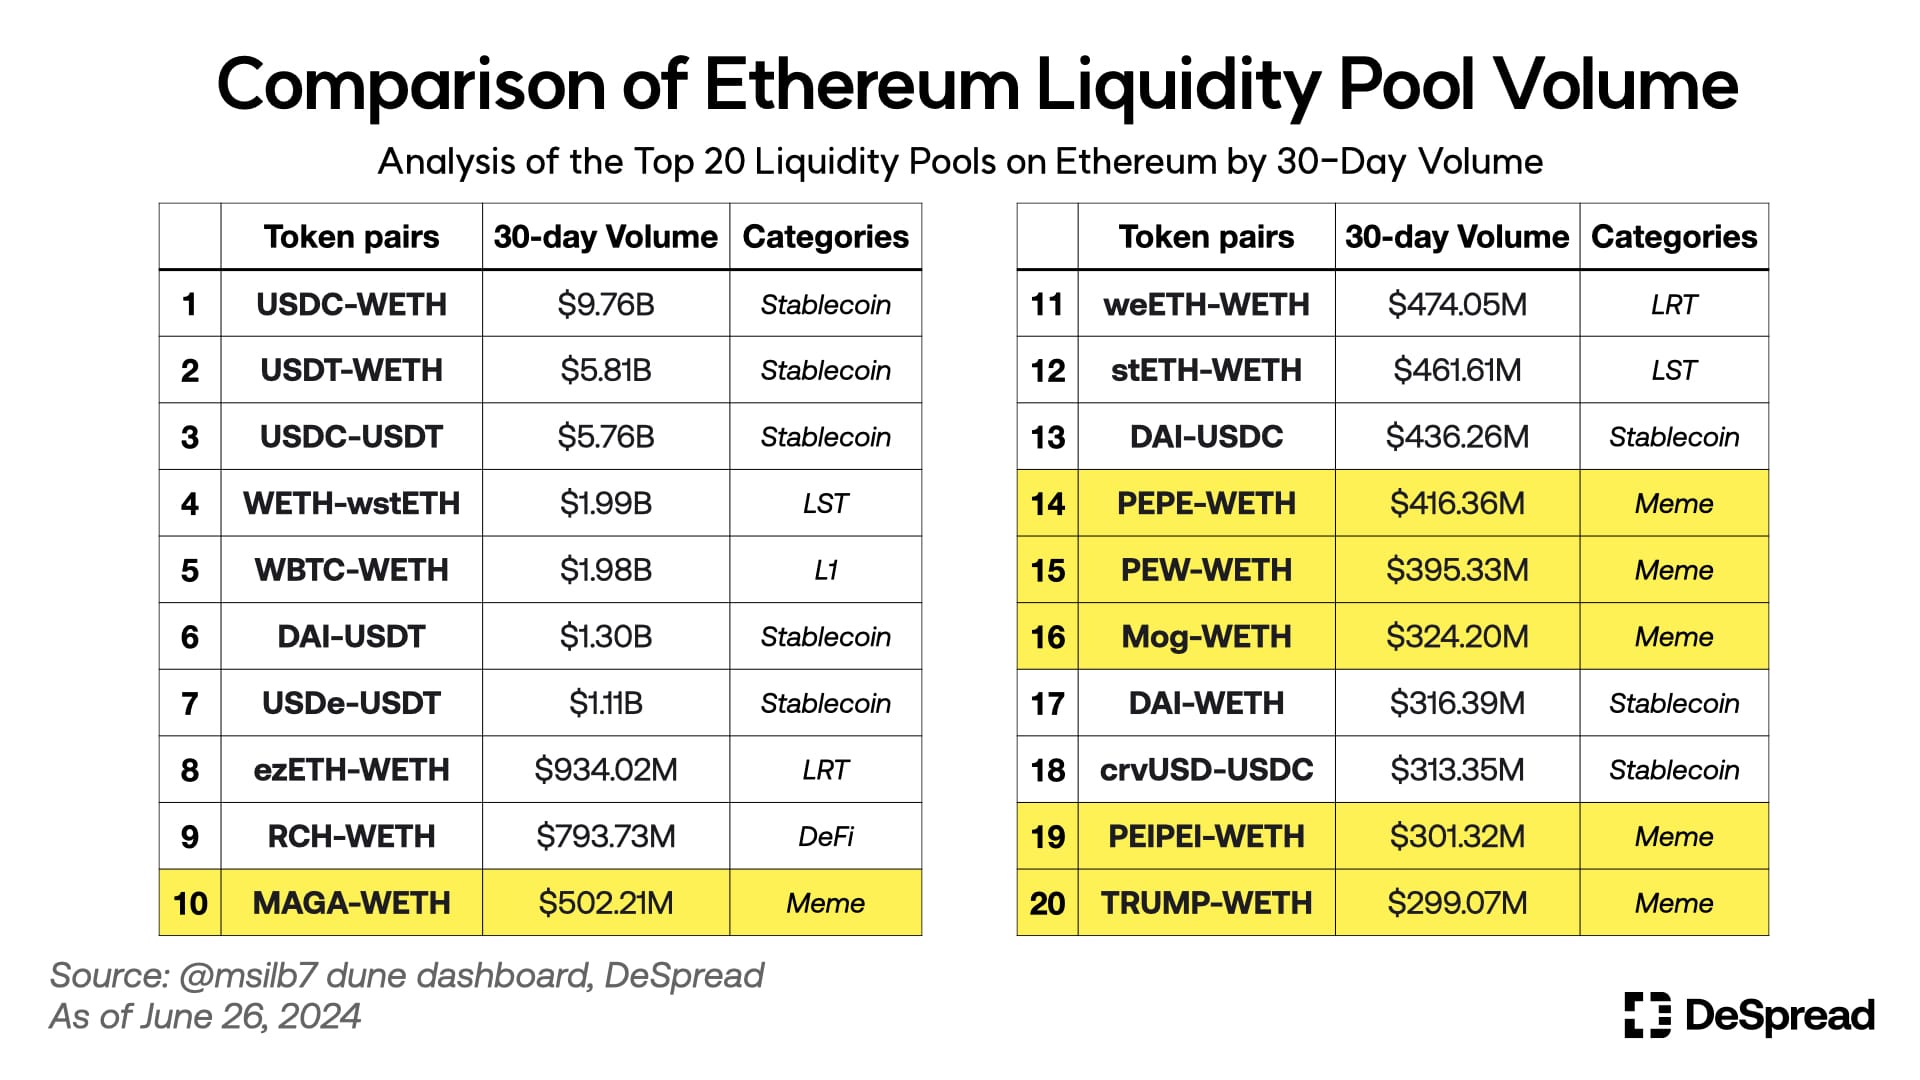
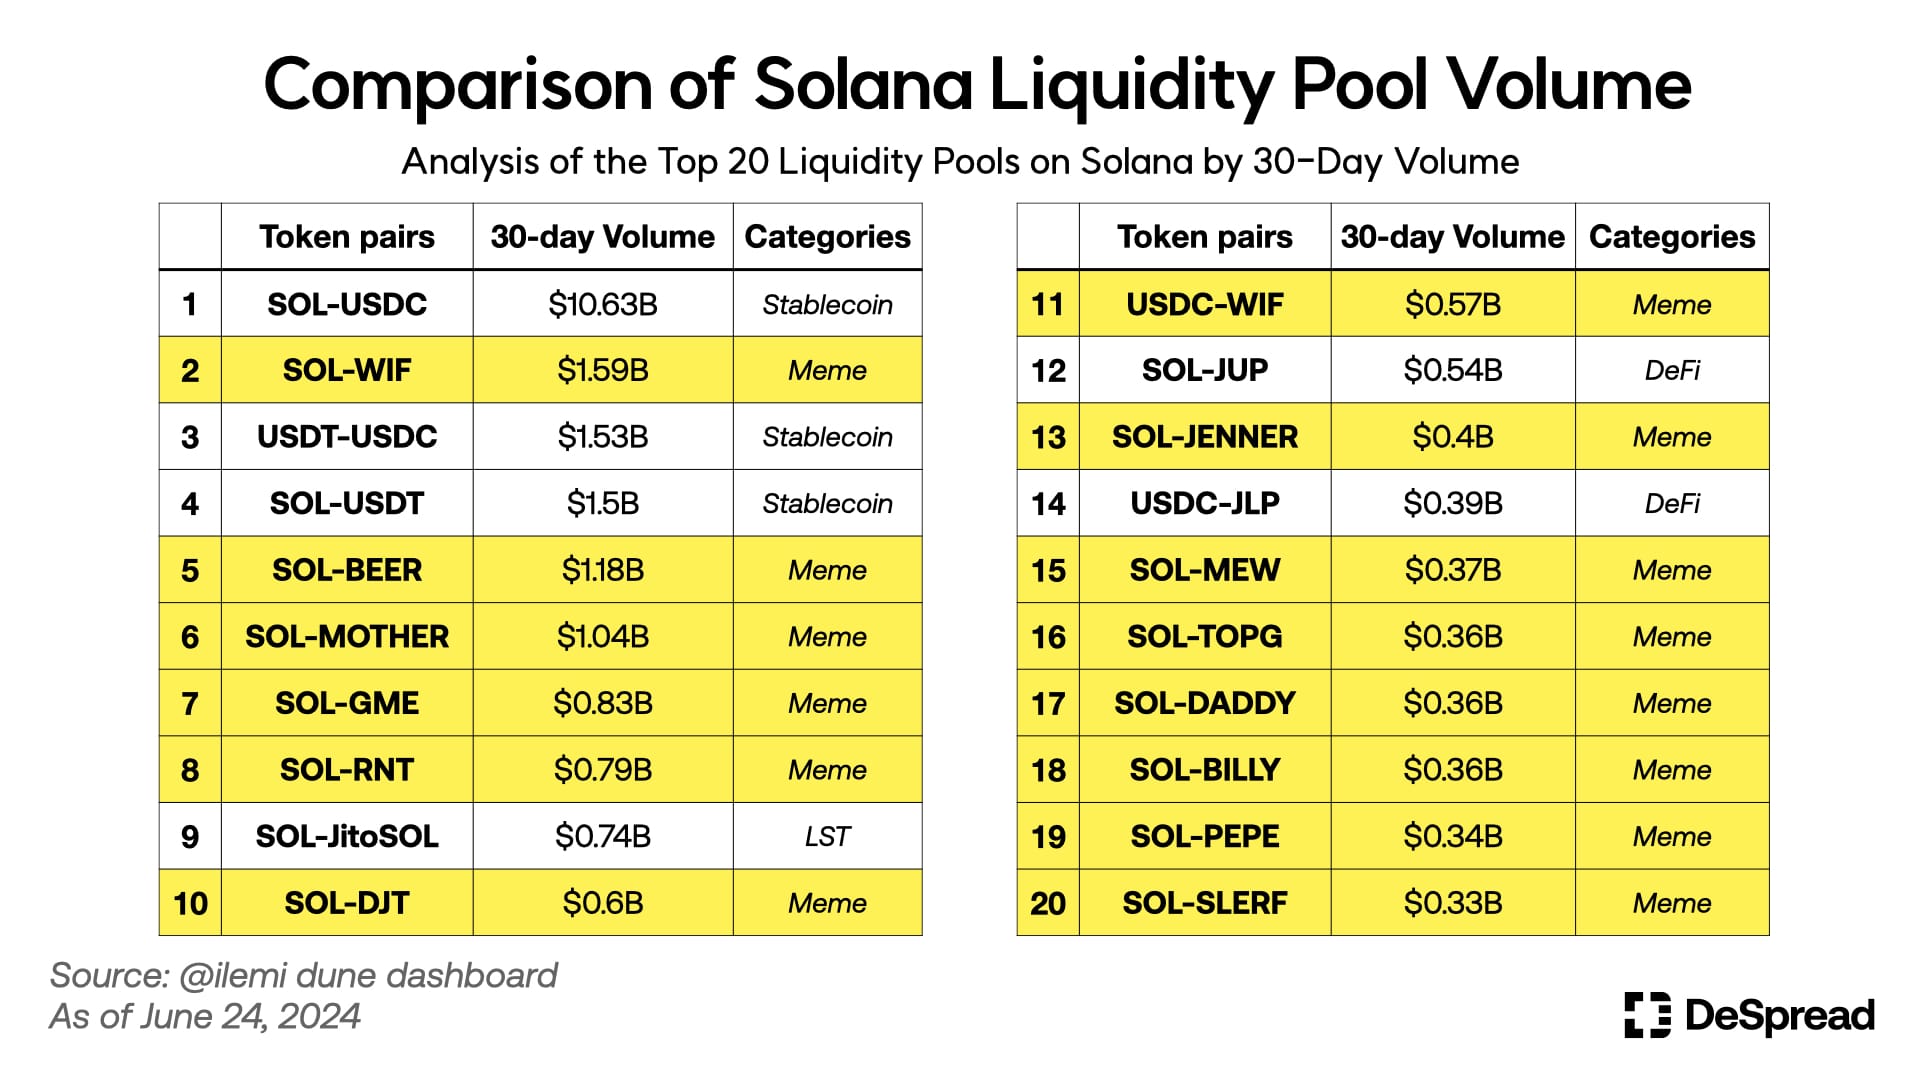
The chart helps to better understand the on-chain trading tendencies of the Ethereum and Solana chains. Analyzing the top 20 liquidity pools by trading volume over the past 30 days reveals the following trends:
- On Ethereum, only 6 out of the top 20 liquidity pools were related to meme coins.
- On Solana, 14 out of the top 20 liquidity pools were related to meme coins.
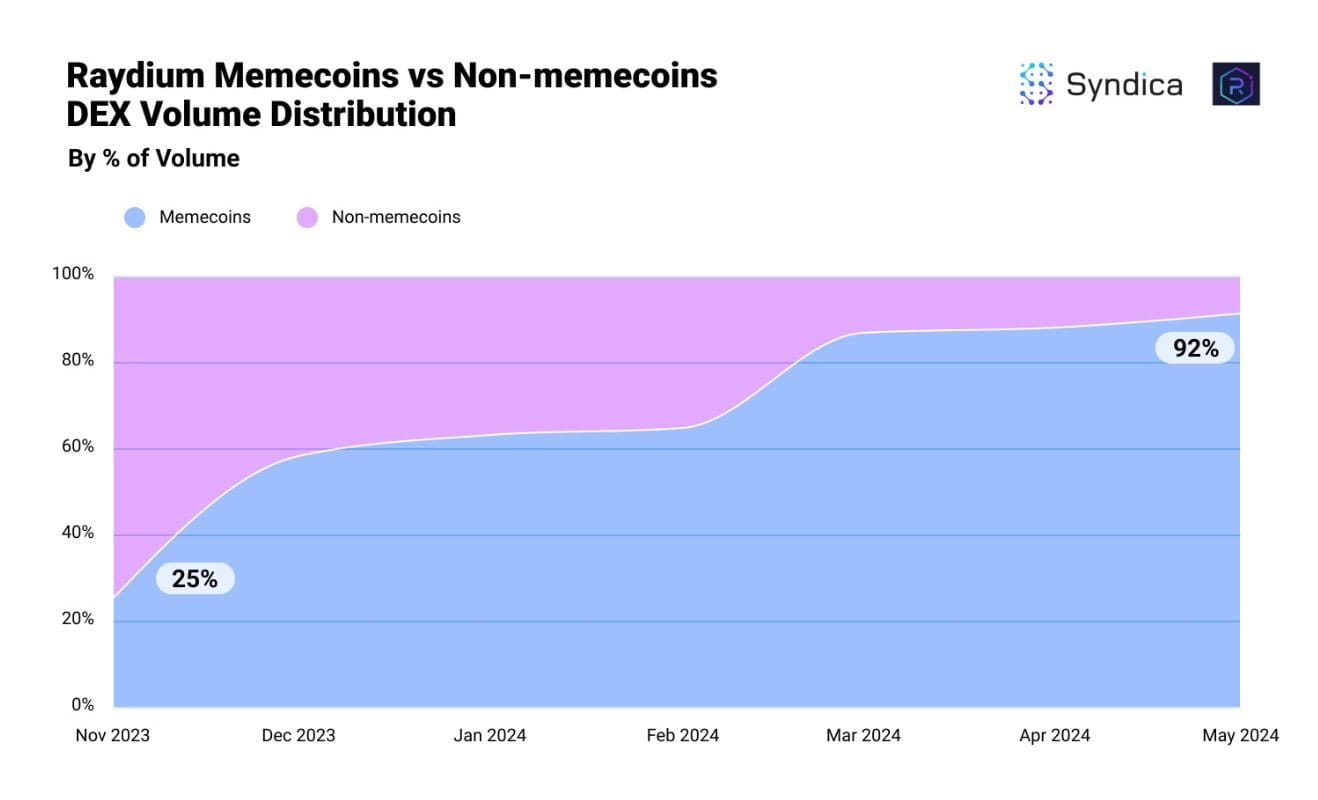
This indicates that the active on-chain trading on Solana has been significantly influenced by meme-coin trading, making Solana a major platform for the resurgence of the meme-coin sector. Supporting this, well-known crypto influencer Wazz cited Syndica in a tweet, noting that meme-coin related trades on Raydium (a major Solana DEX) surged from 25% in November of last year to 92% recently.
5. Struggling New Projects
Recently, major projects such as Starknet, zkSync, and LayerZero, which have been highly anticipated by market participants for their token airdrops, have sequentially launched their tokens. However, these token launches have provided lower-than-expected returns to airdrop participants. Amid a stagnant market, the token prices have also not performed well, leading to diminished enthusiasm and expectations for the airdrop meta and new project launches. This shift in sentiment reflects the broader challenges facing the cryptocurrency market during this period.
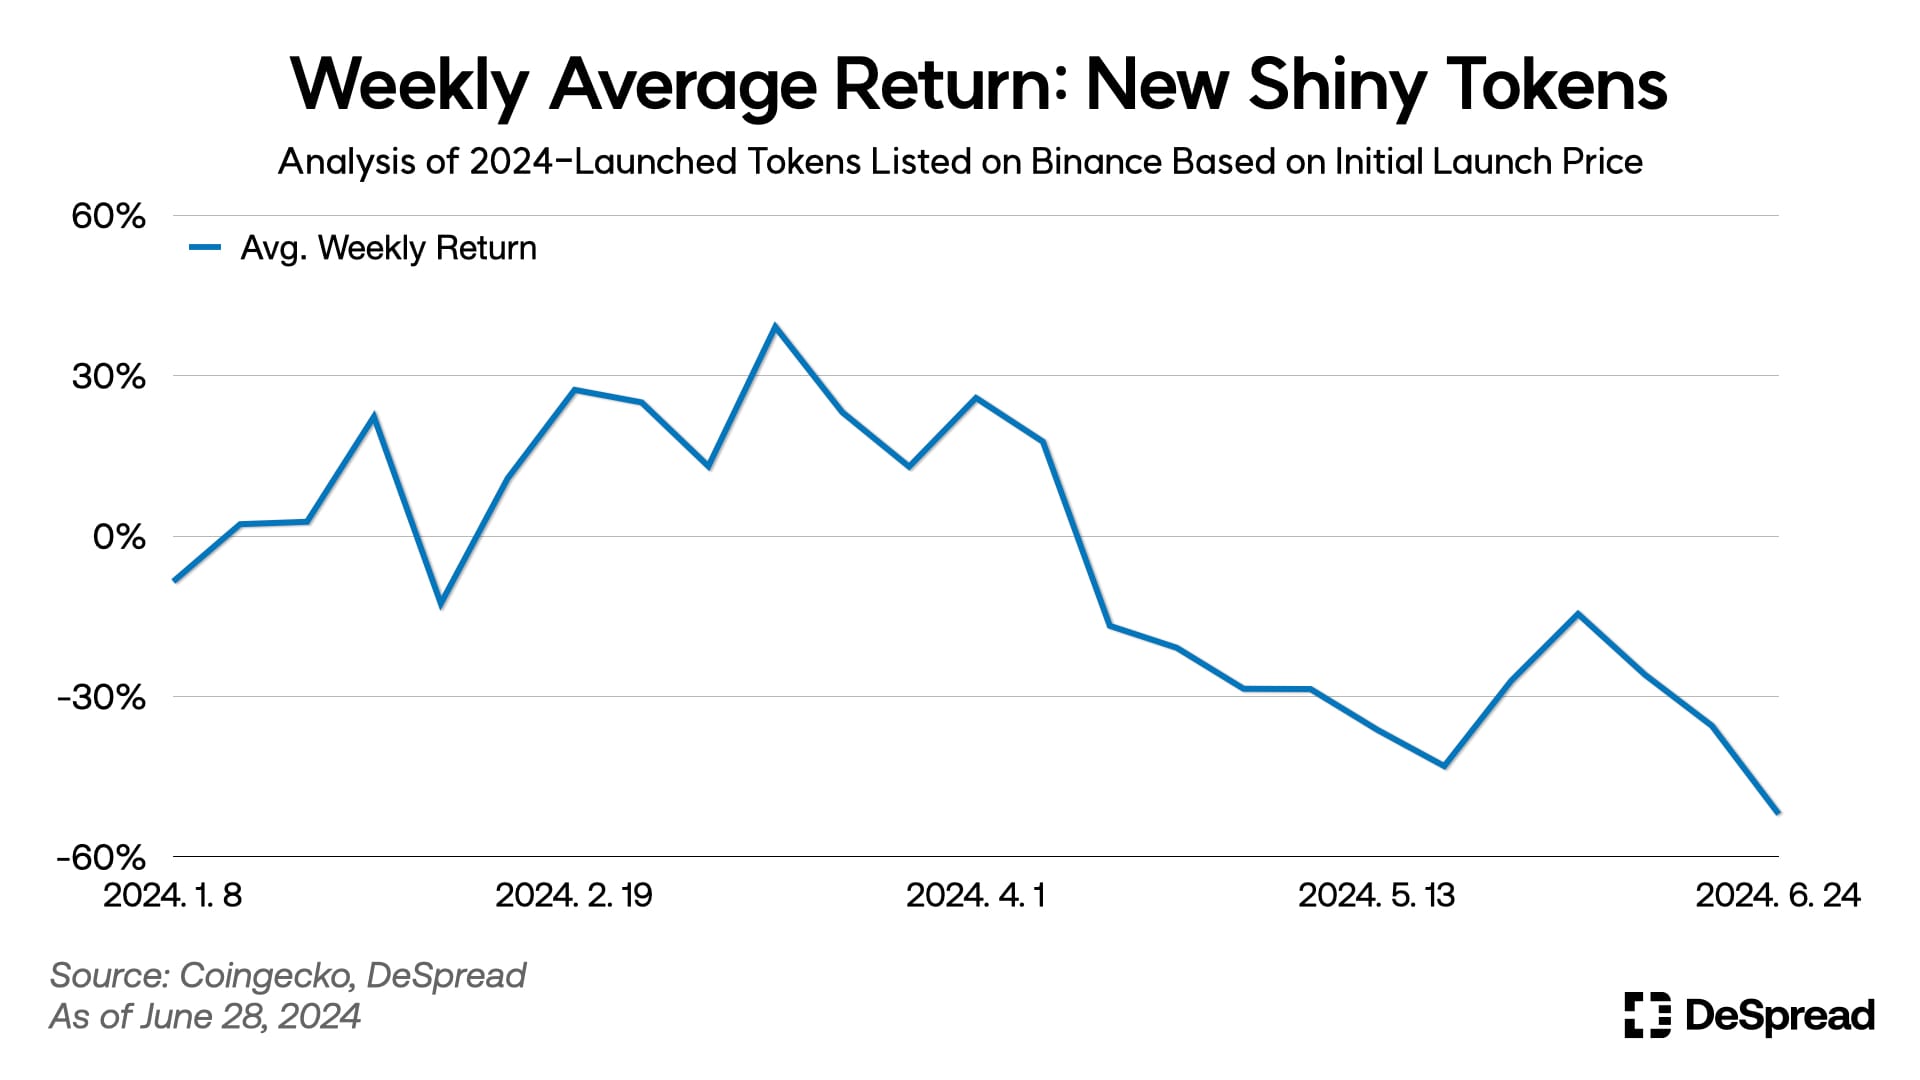
Indeed, analyzing the weekly average returns of tokens launched in 2024 and listed on Binance reveals the following trend:
- Until March, amid rising trading volumes and market capitalization in the cryptocurrency market, new tokens recorded weekly average returns of up to 20-30%.
- However, from mid-April onwards, the weekly average returns began to decline and have progressively worsened.
This trend indicates a decreasing enthusiasm and profitability for newly launched tokens, reflecting broader market stagnation and changing investor sentiment.
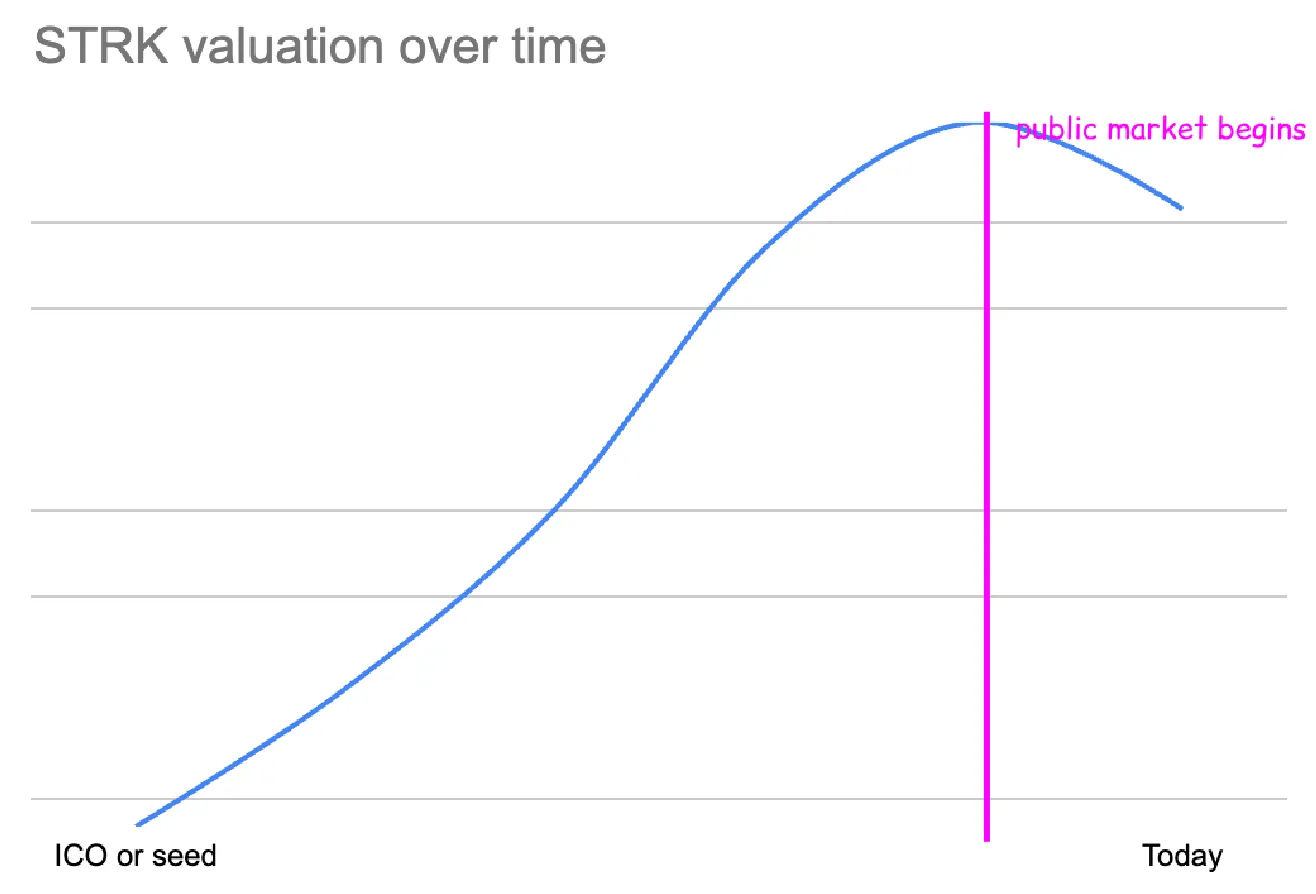
Crypto influencer cobie highlighted in his writing that the valuation discovery of recent projects primarily occurs during private funding stages. This often results in tokens being overvalued at the time of their market release. Cobie further elaborated in a tweet that newly launched tokens tend to have a "low float" and "high FDV (Fully Diluted Valuation)" when introduced to the market. He suggested that this trend, exacerbated by the airdrop meta, has led to increasing noise and issues in recent project operations. Consequently, cobie speculated that the airdrop meta might come to an end following the launch of LayerZero.
Additionally, an increasing number of market participants are questioning the effectiveness of token airdrops conducted by recently launched projects. There is growing curiosity about whether future projects will adopt new strategies instead of relying on airdrops, or if the concerns about the airdrop meta are merely unfounded worries. Observing the future market trends will provide more clarity on this matter.